What are individuals doing now? Over the past three months through February, they purchased $72 billion in equity mutual funds and $9.3 billion in bond funds. The equity inflows represent the best three-month total since February 2007. The bond inflows represent the worst three-month total since late 2008, just before individual investors went on a bond-buying binge during 2009 and most of 2010.
Wednesday, March 30, 2011
Consumer Confidence Index
Monday, March 28, 2011
Earned Income in Personal Income
NIPA Corporate Profits and Cash Flow
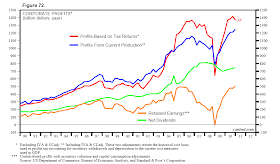
One of the most important reasons to be optimistic is that corporate profits remain in a super-normal recovery. That’s been my main theme for the past two years. It still is, because it is still working. Last week, the Commerce Department reported some record breaking results for profits in the National Income & Product Accounts (NIPA) during Q4-2010. After-tax corporate profits from current production--i.e., on a cash flow basis reflecting inventory valuation and capital consumption adjustments (IVA and CCA)--rose to a record $1,250.2 billion (saar). It is up 61.4% from the most recent cyclical low during Q4-2008. It is 7.9% above the previous cyclical peak during Q3-2006. Undistributed profits with IVA and CCA rose to a record $504.8 billion (saar), up sharply from the most recent cyclical low of -$2.9 billion during Q4-2008. Dividends totaled $745.4 billion, up 6.5% from the most recent cyclical low during Q3-2009. |
Wednesday, March 23, 2011
Fundamental Stock Market Indicator
The CRB raw industrials spot price index is our favorite indicator of global economic activity. It is highly correlated with measures of global industrial production and the volume of world exports. We like it because it includes 13 industrial materials prices and excludes energy and wood commodities. The index rose to a record high of 625.2 on March 4. It was down 3.1% from that high on March 16, and on March 22 was back to 620.6, only 0.7% below the peak. Our trusty CRB index includes the price of copper, which is our favorite of the 13 components in the CRB index. Copper hit a record high of $4.62 a pound on February 14. It is trading at $4.38 this morning. This year’s low was $4.13. We view $4 as key support. A drop below that, if confirmed by a break in the CRB index, would shake our confidence in the resilience of the global economy.
Monday, March 21, 2011
Was QE-2.0 Necessary?
Sunday, March 20, 2011
US Business Cycle Indicators
Wednesday, March 16, 2011
Bond Yield Model
Japan's Electricity Usage
The fact is that Japan’s economy, the third largest in the world, is in big trouble. The country’s Federation of Power Companies provides monthly data on electric power consumed by large users. It rebounded 25.7% from a cyclical low of 19.4 billion Kwh during March 2009 to 24.3 billion Kwh during January 2011. That was still 5.3% below the record high during February 2008. By some accounts, Japan’s electricity output may now be down by at least 25%. That would put usage by large users back at a recession reading of around 18.0 billion Kwh.
The fact is that Japan’s economy, the third largest in the world, is in big trouble. The country’s Federation of Power Companies provides monthly data on electric power consumed by large users. It rebounded 25.7% from a cyclical low of 19.4 billion Kwh during March 2009 to 24.3 billion Kwh during January 2011. That was still 5.3% below the record high during February 2008. By some accounts, Japan’s electricity output may now be down by at least 25%. That would put usage by large users back at a recession reading of around 18.0 billion Kwh.
Tuesday, March 15, 2011
S&P 500 Weekly Earnings
Sunday, March 13, 2011
World Trade
 |
Despite all the chatter about double dips, government debt crises, and asset bubbles, the volume of world exports rose to a new record high at the end of last year. This data series, which is compiled by the Netherlands’ Bureau for Economic Policy (CPB), is very highly correlated with the OECD’s measure of global industrial production, which hit a new record high at the end of last year. We update this chart regularly for subscribers in World Trade Alert. |
 |
The world exports series is also highly correlated with the CRB raw industrials spot price index, which is also at a record high. These three measures all attest to the resilience of the global boom. |
Thursday, March 10, 2011
US Petroleum Inventories
 |
During the week of March 4, gasoline stocks totaled 229.2 million barrels. That's about as much as a year ago. |
Wednesday, March 9, 2011
Tuesday, March 8, 2011
Bullish Fundamental Indicators
 |
If the market continues to rally despite the turmoil in the Middle East, it will be because the US economic expansion is showing more signs of strengthening. The latest evidence of that is January’s survey of small business owners, as discussed below. Even more impressive is the recent vertical ascent of our Fundamental Stock Market Indicator, which has been very closely correlated with the S&P 500 for some time, especially during the current bull market. It jumped to 109.7 during the week of February 26. That’s a new cyclical high, and up 13.3% from 96.9 at the end of last year. Driving it higher recently have been the drop in initial unemployment claims and the continued strength in the CRB raw industrials spot price index. (We update this chart regularly for subscribers in Fundamental Stock Market Indicator Alert.) |
 |
The Small Business Optimism Index, which is based on 10 of the survey’s indicators, rose to 94.5 in February. That’s the best reading since the end of 2007, and well above the March 2009 low of 81.0. It is still well below readings of around 100 that were the norm during the good times from 1986-2006. However, that means that there is room for improvement, which is likely over the rest of the year. (We update this chart regularly for subscribers in Small Business Survey Alert.) |
S&P 500 & Crude Oil
 |
On several occasions over the past year, I’ve observed that three is the charm among the four years of presidential terms. The S&P 500 has been up 18.4%, on average, during the past 14 third years of the presidential cycle without one down year. The market was tracking its historical composite very closely until the past couple of days. The S&P 500 closed at 1310.13 yesterday, 2.4% below the third-year composite index. The third-year composite for the S&P 500 rises to 1489 by the end of the year. Our forecast is 1500, which would be a 14.5% gain from yesterday’s close and a 19.3% increase for the year. Will it be different this time because geopolitics will trump domestic politics? (We update these charts regularly for subscribers in S&P 500 During Third Years of Presidential Terms.) |
 |
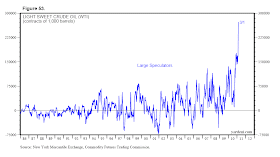
According to the latest CFTC Commitments of Traders report, Large Speculators were long WTI crude oil futures contracts to purchase a record 271.9 million barrels during the week of March 1. That’s up 89.7% from 5 weeks ago, and the highest ever. If and when the turmoil in the |
Monday, March 7, 2011
Labor Market Indicators
 |
Wednesday, March 2, 2011
S&P 500, Oil, & Copper
Corn & Oil Prices
Tuesday, March 1, 2011
Wages & Salaries in Personal Income
 |
Since 1959, the percentage of personal income attributable to government social benefits has increased from 5.9% to 17.7% currently. (We update these charts monthly for our subscribers in Social Welfare In America.) |


