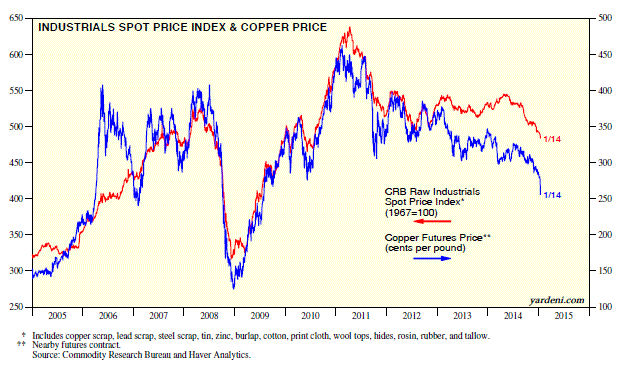
The CRB raw industrials spot price index is a great indicator of global economic activity. It includes the price for copper scrap, which has led the index’s recent decline. The nearby futures price of copper has plunged so far this year by 10% after falling 18% last year. The price of copper is also highly correlated with the price of a barrel of Brent crude oil.
Dr. Copper is widely perceived to be the base metal with a PhD in economics. Many investors view the price of copper as one of the best indicators of global economic activity. Its recent drop is raising fears that maybe the plunge in oil prices is attributable not just to too much supply but also to not enough demand.
That’s possible. But there may also be too much supply of copper, rather than a sudden dearth of demand for the metal. An article on commodity gluts in the 1/11 WSJ observed: “Take copper. The worst performer among base metals last year, it has shed 14% of its value on the back more than four straight years of oversupply. Yet, new mines, including the Sierra Gorda mine in Chile that was inaugurated in October, continue adding to the glut. The Constancia mine, set to begin operations in Peru next year, looks to add even more.”
Today's Morning Briefing: Warning Flags? (1) It’s all up to American consumers. (2) Can the US continue to decouple? (3) Inflation-adjusted retail sales were very strong during Q4. (4) Weekly consumer confidence has been rising fast recently. (5) Real hourly pay at record high. (6) Green, yellow, and red flags. (7) CRB raw industrials spot price index breaking down. (8) Copper following oil price. (9) Excess supply or shortage of demand? (10) Forward earnings turns down along with Boom-Bust Barometer and Fundamental Stock Market Indicator. (11) Commodity currencies getting weaker. (More for subscribers.)


No comments:
Post a Comment