Thursday, April 28, 2011

QE & ZIRP

Fed Chairman Ben Bernanke yesterday confirmed that QE-2.0 will be followed by QE-2.5. The Fed will purchase Treasuries with the proceeds from maturing securities in its portfolio. Here is a brief history of QE:

(1) QE-1.0 started during the week of November 25, 2008, when the Fed began buying mortgage-backed securities (MBS) and agency debt for the first time. The program terminated in March 2010, when this portfolio peaked at $1.24 trillion and the Fed’s balance sheet had risen to $2.31 trillion.

(2) QE-1.5 was announced on August 10, 2010, when the Fed started purchasing Treasury securities to offset maturing MBS and agency debt. (During QE-1.0, the Fed added $300.3 billion in Treasuries to its existing portfolio of these securities.)

(3) QE-2.0 was first vetted by the Fed Chairman in his August 27, 2010 speech at the Fed’s Jackson Hole meeting. It was officially implemented on November 3 with the announcement that the Fed would purchase $600 billion in Treasuries by the middle of 2011, and offset maturing securities with additional purchases of such securities. At the time, the Fed’s holdings of Treasuries was $839.9 billion. The latest figure shows that it was up to $1.39 trillion during the week of April 20.


During all the rounds of quantitative easing, the federal funds rate has remained near zero. In my opinion, the main impact of them was to reinforce the Fed’s zero interest rate policy (ZIRP). There was no chance that the Fed would raise interest rates while it was engaged in QE. ZIRP is the policy that is boosting stock prices and commodity prices and depressing the dollar. And, just as a reminder, ZIRP will continue for “an extended period.” Fed Chairman Ben Bernanke explained yesterday that means no rate hike for at least the next two FOMC meetings.

Wednesday, April 27, 2011

Consumer Confidence

It was a bit surprising to see the overall Consumer Confidence Index (CCI) rise from 63.8 in March to 65.4 in April given the recent surge in gasoline prices. The Conference Board’s survey tends to put more weight on the employment situation, which is improving, than on other factors that influence consumer confidence. The present situation component of the CCI has been up for the past seven months. However, it remains relatively depressed at 39.6, which is still below the previous cyclical trough of 59.7 during September 2003.


The weakness in the present situation component this far into an economic recovery is unusual, but not surprising given that 4 out of 10 respondents agree that it is hard to get a job. The percentage of respondents saying that “jobs are hard to get” fell to 41.8% during April. That is the lowest reading since January 2009. The most recent cyclical peak in this series was 48.8% during November. The labor market is improving, but it is still hard to get a job.

Monday, April 25, 2011

US Earnings, Global Exports, & US Manufacturing

In our Forward Earnings & The Economy chart book (available to subscribers), we track the relationship between S&P 500 forward earnings on a monthly basis and numerous key global and US economic indicators. We are particularly impressed with the relationship between forward earnings and the IMF’s measure of the value of global exports, as well as the measure of the volume of global exports compiled by the Netherlands Bureau for Economic Policy (CPB). The V-shaped recovery in profits has been driven by the V-shaped recovery in global exports measured either way. The volume index rose to another record high during February, exceeding its previous high during April 2008 by 5.1%. It is up a whopping 66.5% since 2000.

The growth rate of forward earnings is also highly correlated with the manufacturing purchasing managers index (PMI) based on the monthly survey conducted by the Institute for Supply Management. The M-PMI was 61.2 during March, matching previous cyclical highs. That probably means that the growth rate in earnings may be peaking. However, that doesn’t mean that it won’t continue to grow along with world exports.

Wednesday, April 20, 2011

Global Oil Demand Growth

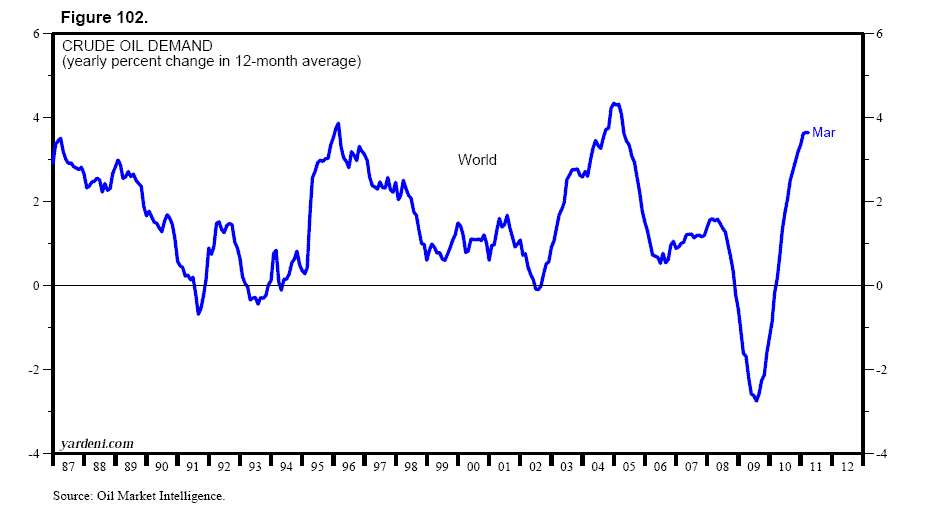
While there might be plenty of oil around, there are also plenty of risks that its supply will be disrupted. Meanwhile, global demand for crude continues to rise to new record highs, hitting 88.5mbd on average over the 12 months through March. On this basis, it is up 3.6% y/y, the same as in February. This growth rate may be peaking because high oil prices may be slowing it down.


Interestingly, the growth rate in crude oil demand among the 30 OECD economies rose to a new cyclical high of 2.2% in March, while it dropped to 5.2% for non-OECD countries from the most recent cyclical peak of 5.7% during August 2010. This may be an early warning that slower growth may be ahead as high oil prices are pushing up inflation rates in emerging economies, forcing their central bankers to tighten and to slow economic growth. (We update these charts for subscribers to our service in our Global Oil Demand & Supply.)