Yardeni Research will be closed for the holidays until Jan. 2, 2013.


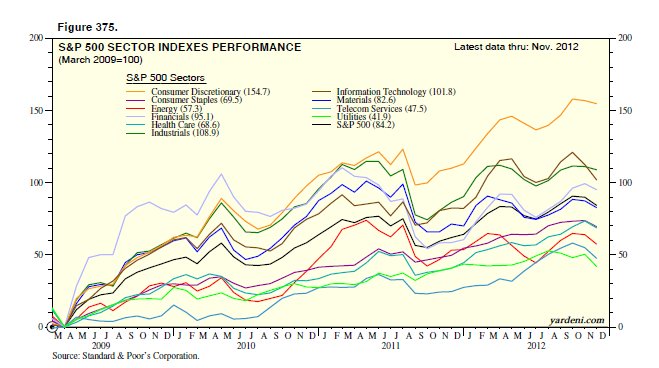 |
One of our accounts asked us to run some charts comparing the performances of the S&P 500 and its 10 sectors since the start of the bull market during March 2009. We used monthly data because the daily and weekly charts were too noisy. We ran similar charts for the previous bull markets starting during October 2002 and December 1994.
The charts remind us of a striking characteristic of the latest three bull markets: The best-performing sector tended to outperform all the others from the beginning through the end of the bull market. So during the bull market of the 1990s, Information Technology was the pacesetter. During the previous decade’s bull market, it was Energy. This time it has been Consumer Discretionary. While past performance is no guarantee of future results, we do expect that Consumer Discretionary may continue to outperform in 2013. Today's Morning Briefing: Three Wise Guys. (1) A quick and catchy response: "1465/1565/1665." (2) Predicting earnings of $118 per share for 2014. (3) In the “green room” with three budget pros: Bernstein, Lindsey, and Stockman. (4) Leaving the bill for the kids to pay. (5) Still gaming and blaming in DC. (6) German business confidence is up. (7) So is global oil demand. (8) Emerging economies leading the way. (9) S&P 500 sectors: And the first shall remain first. (10) Season’s Greetings and Happy New Year! (More for subscribers.)   |
 |
Our Blue Angels analysis of the S&P 500 shows that its forward P/E rebounded from a recent low of 12.1 on November 15 to 12.7 yesterday. In the Santa rally scenario, it should soon retest 13, which has been an unlucky number since early 2010. The market had three nasty corrections since then after failing to rise above this valuation level.
The fourth assault on 13 could be the charm. If so, then the valuation multiple could rise quickly to 14, a level not seen since early 2010, just before Greece hit the fan. S&P 500 forward earnings edged back up to $112.77 per share during the week of December 13, just a nickel below its recent record high. A 14 multiple on that number would put the S&P 500 up to 1579, slightly above the previous record high.
The S&P 500 forward P/E is highly correlated with the Citigroup Economic Surprise Index and with the CRB metals spot price index. That’s not surprising since investors are more likely to pay higher valuation multiples for earnings when they have more confidence in the economy. Both the surprise and the metals indexes have firmed up in recent weeks. Today's Morning Briefing: Santa. (1) Looking up. (2) Nice round numbers: 1465 then 1565. (3) Barack, John, and Nick. (4) The rich will get richer. (5) Fiscal deal taking shape. (6) Devil is in the details. (7) Room for higher valuation multiple. (8) Analysts too optimistic about earnings in 2013 and 2014. (9) But there’s room for improvement. (10) Picking the leaders and laggards of 2013. (More for subscribers.) 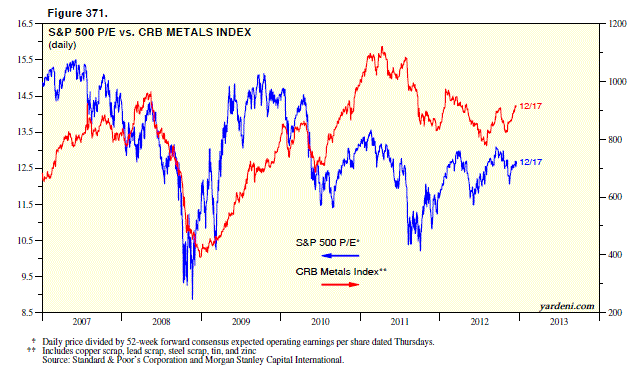 |
 |
Stock markets discount the future. As a result, they often provide a contrarian viewpoint relative to consensus opinions, which tend to give more weight to current events and the latest data points. So, for example, recently released data for the euro area show that the region has been in a recession for the past two quarters. Yet the MSCI Europe stock price index bottomed this year on June 4 and is up 19.1% since then.
The S&P 500 is only 3.6% below its September 14 bull market high notwithstanding all the anxiety about the looming fiscal cliff. We now have Q3 data for the revenues and earnings of the S&P 500. The growth rates of both have dropped sharply, close to zero during the quarter. They certainly don’t explain why the market has been so resilient unless the outlook for both is that growth will soon turn up. That’s my forecast. Let's have a closer look at the latest data:
(1) Revenues. S&P 500 revenues per share rose 0.6% y/y during Q3, the weakest growth rate since Q3-2009, and well below the latest cyclical peak of 11.2% during Q2-2011. It is highly correlated with total US manufacturing and trade sales, which has been hovering around 3% y/y over the past five months, and remained near September’s record high during October.
(2) Earnings. S&P 500 operating earnings rose to a new record high of $25.98 per share during Q3, up 1.3% y/y. This is based on data compiled by Thomson Reuters I/B/E/S. The number in S&P's compilation edged down on a q/q basis to $24.39, falling 3.6% y/y. In any case, we are expecting that better global economic growth next year will boost the growth rates of both revenues and earnings to 5%-7% in 2013. That won’t happen if the US falls off the fiscal cliff. However, if the cliff is averted, US economic growth is likely to be surprisingly strong given that lots of pent-up demand has been building, especially in housing-related industries. Today's Morning Briefing: The End Is Not Near. (1) The world ended for the Mayans many moons ago. (2) Will Dec. 21 be a Day of Infamy? (3) A fourth year of living dangerously? (4) Stock markets aren’t buying the Mayan scenario. (5) Bulls are running in Shanghai and Tokyo. (6) New leaders in China and Japan. (7) No recession in MSCI Europe. No cliff in US stocks. (8) Revenues and earnings should start growing again in 2013. (9) Emerging economies leading the way in globalization. (10) Dr. Ed’s Movie Reviews 2012. (More for subscribers.)  |
