Monday, February 28, 2011

Gasoline Usage in US


There is already plenty of chatter about the price of gasoline rising to $5 a gallon this summer. That may be coming from speculators talking up their positions. The spot-month RBOB gasoline futures contract has rallied 30 cents last week, pushing to price levels not seen since the 2008 spike. That’s even though the latest weekly EIA stock numbers for gasoline came 13.3 mb above the five-year average and 7.1 mb above last year at this time. Energy markets are soaring due to an inflow of noncommercial money into the energy futures pits. So far, the geopolitical situation favors their bullish bet. So does the calendar: The summer driving season is only a few months ahead. Wars have a tendency to start during the summer in the Middle East.


The pump price of gasoline in the US rose to $3.17 a gallon during the week of February 23. It is up 14 cents since the end of last year and 54 cents from a year ago. Americans used 9.1mbd of gasoline, on average, over the past 52 weeks. There are 42 gallons in a barrel. So Americans used 382.2 million gallons per day, on average, or 143.3 billion gallons in total over the past year. That means a one dollar increase in the price of gasoline takes almost $150 billion out of consumers’ purchasing power.

Wednesday, February 23, 2011

Global Oil Bill

The global oil bill soared to a record $4,252bn (annualized) during June 2008. It then plunged to $1,256bn during December 2008. That drop of $2,996bn was unprecedented and undoubtedly was one of the reasons why the global economy recovered so quickly over the past two years. The oil bill rebounded 149% back to $3,125bn during January 2011 from the 2009 trough. The good news is that global oil usage has increased nearly 3mbd over this period, reflecting the recovery in global economic activity. The 190% increase in the price of oil over this period also reflects the recovery, but it is also cutting into consumers’ purchasing power. The recent spike in the oil price is more troubling since it reflects possible supply disruptions. We update this chart regularly for subscribers in Analyst's Handbook: Energy.


Tuesday, February 22, 2011

S&P 500 Forward Earnings

Forward earnings rose again in February to a 31-month high after falling for nine straight months through May 2009. It rose 1.2% m/m in December and is just 4.6% below the record high in October 2007. Consensus annual earnings for 2011 and 2012 rose in February. Analysts expect earnings to rise 14.0% in 2011 and 14.1% in 2012 after surging 40.3% in 2010. We update this chart regularly for subscribers in Earnings Month (with Squiggles).

The forward P/E for the S&P 500 rose to a 10-month high of 13.5 in February from 13.1 in January. It is up from an 18-month low of 12.0 in August.

Gasoline Price & Leading Indicators

The price of gasoline isn’t one of the ten components of the Index of Leading Economic Indicators (LEI) in the US. Nor is it included in the LEIs of the other major economies around the world. However, maybe it should be. That’s because rapidly rising gasoline prices led or coincided with all six recessions since 1973. It might be different this time because Fed policy is likely to remain stimulative even if higher gasoline prices boost the headline CPI inflation rate. The latest batch of LEIs suggests that the global economy has plenty of forward momentum for the first half of 2011. If gasoline prices continue to rise along with crude oil prices in coming weeks, then the outlook for global economic growth during the second half of the year is bound to be reflected in weaker LEIs by mid-year.


According to the Philly Fed’s monthly survey, the region’s manufacturing sector continues to expand at a fast pace. The current activity index increased for the fifth time in six months, climbing from -5.6 in August to +35.9 this month, the best reading since January 2004. The new orders index was little changed at 23.7 in February. The shipments index rose for the fifth straight month, jumping 21.8 points in February. The employment index increased for the second straight month from 4.3 to 23.5, the highest since April 1973. The ISM composite index is highly correlated with the 3-ma in the Philly Fed current activity index, which suggests robust manufacturing activity at the national level. We update these charts regularly for subscribers in US Business Surveys.

Wednesday, February 16, 2011

Crude Oil

My investment strategy recommendations continue to overweight the beneficiaries of the global boom. However, if the price of oil spikes to $150 a barrel over the next few months as a result of turmoil in the Middle East, all bets are off. Brent closed at $104.21 on Wednesday, the highest since September 5, 2008. It is up from a 2010 low of $69.19.

I still expect that OPEC nations will pump more oil to avert a spike in oil prices. It is in their interest to do what they can to reduce global instability caused by higher fuel prices. The only problem is that there is mounting political instability in OPEC oil producers such as Algeria, Iraq, Iran, Libya, and Bahrain.


China's Currency

Every five years, the National Bureau of Statistics conducts a major revision of the way it measures inflation. It did so with the release of January’s CPI on Tuesday. There was a 4.2 percentage point increase in the share of housing costs in the basket of consumer goods used to measure inflation. The weightings of a series of other items were lowered, notably food, which it cut by 2.2 percentage points. In December, China’s CPI rose 4.6% y/y, compared with November’s 5.1%, which was the fastest in more than two years. According to the official data, annual consumer prices rose 4.9% in January. Economists polled by Reuters had expected 5.3%. Food prices rose 10.3%. Excluding food, the CPI rose 2.6%, the highest in the history of the series going back to 2002, and led by a 6.8% increase in housing costs. Rents are rising rapidly in China, along with wages.

So why don’t the Chinese let their currency appreciate already? That way, they won’t be flooding their banking system with reserves, so higher reserve requirements will actually tighten the availability of credit. Imports will be cheaper priced in local currency terms, which would also relieve some inflationary pressures. Exports might be depressed, but that might encourage manufacturers to produce more products for domestic rather than foreign consumption. So why don’t the Chinese stop pegging the yuan? Well, apparently they may have stopped doing just that without telling anyone. The yuan was pegged around 6.82 yuan/dollar from July 18, 2008 through June 18, 2010. Since then, it has been moving higher, and is now around 6.59 yuan/dollar. The last time that the Chinese allowed their currency to appreciate was from July 22, 2005 to July 11, 2008, when it rose 19.8%. I think they’ve started to do it again.


Monday, February 14, 2011

Consumer Sentiment


The Consumer Sentiment Index for high-income families increased for the fourth time in five months from 71.4 in September to 88.2 in mid-February. That’s the best reading since December 2007, and well above the October 2008 low of 57.8. They must be benefitting from the 27.2% increase in the S&P 500 since Mr. Bernanke first mentioned QE2 on August 27, 2010 at the Fed’s annual meeting in Jackson Hole. That amounts to capital gains of $3.18 trillion based on the Wilshire Index. Of course, high-income families must also be pleased that Congress extended the Bush tax cuts for another two years. Washington has been very good to high-income families.


The Consumer Sentiment Index for low-income families reversed nearly all of its recent gains, falling from 72.1 in January to 67.7 in mid-February. Its recession low was 53.3 during November 2008. It has been fluctuating between 64 and 73 since April 2009. Low-income families are not likely to be benefitting from the rally in stocks. They probably remain more vulnerable to long-term unemployment and wage cuts. To add insult to injury, Mr. Bernanke’s focus on core inflation is irrelevant to most of them. Food and fuel costs matter to them more than to high-income families.


Sunday, February 13, 2011

Transportation Stock Indexes


The Dow Jones Transportation Average (DJTA) rose last week to a cyclical high. Dow Theory technicians are most bullish when a rising DJIA is confirmed by its DJTA cousin.


The S&P 500 Transportation Index rose to another record high at the end of the week. It was led by another record high for the Railroads industry.


Wednesday, February 9, 2011

Small Business Survey


SBOI rose for the fifth time in six months, climbing from 88.1 in July to 94.1 in January, the highest reading since the end of 2007. Seven of the 10 indicators were up in January, one down, and two unchanged. Earnings trends and sales expectations were the biggest positive contributors.


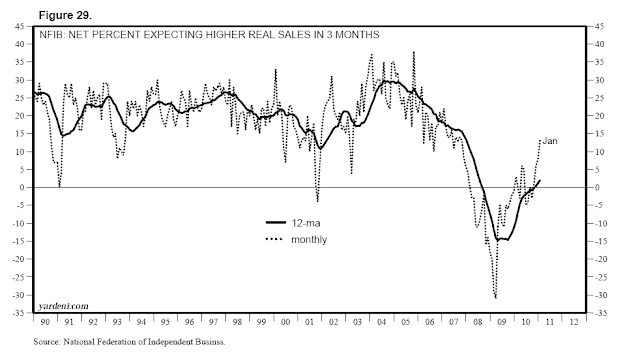
The net percent of small business owners expecting gains in real sales volumes improved for the fourth straight month from a net negative 3% in September to a net positive 13% in January, the highest since October 2007. The 12-ma is back in positive territory.
 

Tuesday, February 8, 2011

Fundamental Stock Market Indicator

Is our Fundamental Stock Market Indicator (FSMI) still a good coincident indicator for the S&P 500? We think so. Our FSMI is the average of the Weekly Consumer Comfort Index (WCCI) and our Boom-Bust Barometer (BBB). It gained 2.0% during the final week of January, recovering two-thirds of the loss the prior two weeks. Before the recent decline, it had increased 21 out of 23 weeks. The FSMI is back within 1.2% of its recent high for the cycle.

 
The BBB, which is the ratio of the CRB raw industrials spot price index to the 4-week average of jobless claims, has driven the move up in the FSMI, though it has been in a volatile flat trend in recent weeks as the 4-wa in jobless claims moved steadily higher since the start of the year. Meanwhile, the CRB raw industrials spot price index remains on its vertical ascent. The WCCI plunged 5 points during the first week of February, erasing all the improvement in the early weeks of this year.


Monday, February 7, 2011

Expected Inflation

The one-year expected inflation rate jumped to a 27-month high of 3.4% in January, more than a percentage point above last September's 2.2%. The 5-year expected inflation rate edged up 2.9% from 2.8% the prior three months. It has hovered in a tight range between 2.7% and 2.9% for just over a year.


The spread between the 10-year bond yield and the TIPS yield is considered to be a measure of expected inflation. It is up 40bps from 1.96% on October 8 to 2.36% on February 7. It was near zero at the beginning of 2009. The expected inflation rate in the TIPS is a good leading indicator of the actual PCED core inflation rate, which dropped to 0.7% in December, the lowest on record going back to 1960!


Sunday, February 6, 2011

Global Liquidity

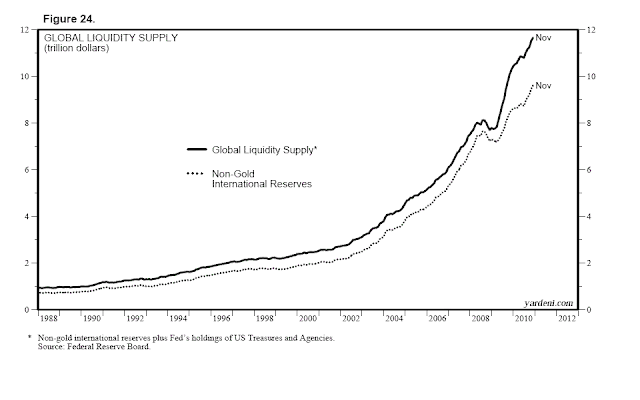
One measure of global liquidity is non-gold international reserves (NGIR), which is compiled monthly by the IMF. It rose to a record high of $9.59tn during November 2010. It is up 33% over the past two years. It has doubled since June 2006. NGIR does not include the Fed’s holdings of US Treasury and Agency securities. Adding these to NGIR shows that the Global Liquidity Supply (GLS) rose to a record $11.6tn during November of last year. It is up 51.4% over the past two years, and has doubled since October 2006.


The holdings of US Treasuries and Agencies by all central banks rose to a record $5.59tn last week, up 82.3% over the past two years.


Thursday, February 3, 2011

Raw Materials Prices

Professor Copper is among the economic forecasters with the best track record. The Good Professor isn’t fazed by all the commotion in the Middle East. The price of copper rose to yet another record high yesterday. When it was around $4 eight weeks ago, I suggested that it might start behaving like a rare earth metal with a vertical ascent in its price causing it to maybe double over the next 18-24 months. There are a few other base metals that may also perform like rare earth metals, making them more precious than even precious metals.


The latest survey of manufacturing purchasing managers showed that the prices-paid component rose to 81.5 in January, the highest reading since July 2008. While rising costs had a limited impact on the fourth quarter’s earnings, more companies are warning that profit margins may narrow in coming quarters.


Tuesday, February 1, 2011

Purchasing Managers Surveys

UK manufacturing activity outpaced US activity for the third straight month, though both accelerated sharply in January.

German PMI plunged along with the Ifo business expectations index in 2008. Both rebounded during 2009, and continued to climb in 2010. The Ifo index is at a high for the series going back to 1991.

Grain Prices

The end of the Cold War led to the integration of national economies through freer trade, which has boosted prosperity around the world. However, the distribution of that prosperity has been lopsided, especially in emerging economies ruled by autocratic regimes. On the other hand, enough people are enjoying rising standards of living to boost the demand for consumer staples and to lift commodity prices. Rising food and fuel prices reflect the success of Globalization in spreading prosperity. They also pose a threat to this prosperity by causing central banks, especially in emerging economies, to tighten their monetary policies in efforts to keep inflation rates from rising.


The riots in the Middle East have been sparked, in part, by widespread discontent over rising food and fuel prices. Governments around the world are likely to respond by hoarding food commodities. That would only exacerbate the inflationary pressures in the grain pits. Indeed, Friday’s FT reported that countries in North Africa and the Middle East have been accelerating their purchases of wheat recently. On the other hand, the Saudis may respond to the upheaval in their neighborhood by pumping more oil in a desperate attempt to relieve the inflationary pressures that are sparking social and political instability on a global basis.