Yardeni Research will be closed for the holidays until Jan. 2, 2013.


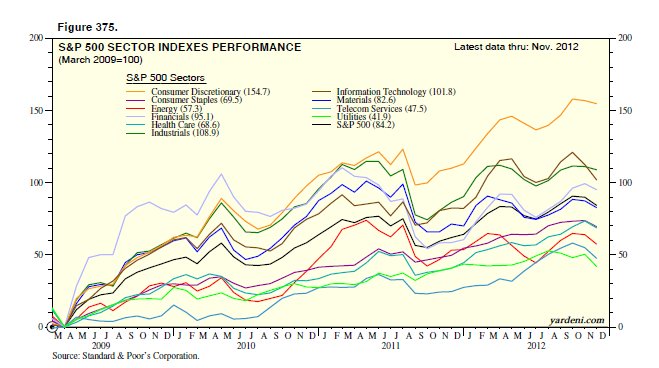 |
One of our accounts asked us to run some charts comparing the performances of the S&P 500 and its 10 sectors since the start of the bull market during March 2009. We used monthly data because the daily and weekly charts were too noisy. We ran similar charts for the previous bull markets starting during October 2002 and December 1994.
The charts remind us of a striking characteristic of the latest three bull markets: The best-performing sector tended to outperform all the others from the beginning through the end of the bull market. So during the bull market of the 1990s, Information Technology was the pacesetter. During the previous decade’s bull market, it was Energy. This time it has been Consumer Discretionary. While past performance is no guarantee of future results, we do expect that Consumer Discretionary may continue to outperform in 2013. Today's Morning Briefing: Three Wise Guys. (1) A quick and catchy response: "1465/1565/1665." (2) Predicting earnings of $118 per share for 2014. (3) In the “green room” with three budget pros: Bernstein, Lindsey, and Stockman. (4) Leaving the bill for the kids to pay. (5) Still gaming and blaming in DC. (6) German business confidence is up. (7) So is global oil demand. (8) Emerging economies leading the way. (9) S&P 500 sectors: And the first shall remain first. (10) Season’s Greetings and Happy New Year! (More for subscribers.)   |
 |
Our Blue Angels analysis of the S&P 500 shows that its forward P/E rebounded from a recent low of 12.1 on November 15 to 12.7 yesterday. In the Santa rally scenario, it should soon retest 13, which has been an unlucky number since early 2010. The market had three nasty corrections since then after failing to rise above this valuation level.
The fourth assault on 13 could be the charm. If so, then the valuation multiple could rise quickly to 14, a level not seen since early 2010, just before Greece hit the fan. S&P 500 forward earnings edged back up to $112.77 per share during the week of December 13, just a nickel below its recent record high. A 14 multiple on that number would put the S&P 500 up to 1579, slightly above the previous record high.
The S&P 500 forward P/E is highly correlated with the Citigroup Economic Surprise Index and with the CRB metals spot price index. That’s not surprising since investors are more likely to pay higher valuation multiples for earnings when they have more confidence in the economy. Both the surprise and the metals indexes have firmed up in recent weeks. Today's Morning Briefing: Santa. (1) Looking up. (2) Nice round numbers: 1465 then 1565. (3) Barack, John, and Nick. (4) The rich will get richer. (5) Fiscal deal taking shape. (6) Devil is in the details. (7) Room for higher valuation multiple. (8) Analysts too optimistic about earnings in 2013 and 2014. (9) But there’s room for improvement. (10) Picking the leaders and laggards of 2013. (More for subscribers.)  |
 |
Stock markets discount the future. As a result, they often provide a contrarian viewpoint relative to consensus opinions, which tend to give more weight to current events and the latest data points. So, for example, recently released data for the euro area show that the region has been in a recession for the past two quarters. Yet the MSCI Europe stock price index bottomed this year on June 4 and is up 19.1% since then.
The S&P 500 is only 3.6% below its September 14 bull market high notwithstanding all the anxiety about the looming fiscal cliff. We now have Q3 data for the revenues and earnings of the S&P 500. The growth rates of both have dropped sharply, close to zero during the quarter. They certainly don’t explain why the market has been so resilient unless the outlook for both is that growth will soon turn up. That’s my forecast. Let's have a closer look at the latest data:
(1) Revenues. S&P 500 revenues per share rose 0.6% y/y during Q3, the weakest growth rate since Q3-2009, and well below the latest cyclical peak of 11.2% during Q2-2011. It is highly correlated with total US manufacturing and trade sales, which has been hovering around 3% y/y over the past five months, and remained near September’s record high during October.
(2) Earnings. S&P 500 operating earnings rose to a new record high of $25.98 per share during Q3, up 1.3% y/y. This is based on data compiled by Thomson Reuters I/B/E/S. The number in S&P's compilation edged down on a q/q basis to $24.39, falling 3.6% y/y. In any case, we are expecting that better global economic growth next year will boost the growth rates of both revenues and earnings to 5%-7% in 2013. That won’t happen if the US falls off the fiscal cliff. However, if the cliff is averted, US economic growth is likely to be surprisingly strong given that lots of pent-up demand has been building, especially in housing-related industries. Today's Morning Briefing: The End Is Not Near. (1) The world ended for the Mayans many moons ago. (2) Will Dec. 21 be a Day of Infamy? (3) A fourth year of living dangerously? (4) Stock markets aren’t buying the Mayan scenario. (5) Bulls are running in Shanghai and Tokyo. (6) New leaders in China and Japan. (7) No recession in MSCI Europe. No cliff in US stocks. (8) Revenues and earnings should start growing again in 2013. (9) Emerging economies leading the way in globalization. (10) Dr. Ed’s Movie Reviews 2012. (More for subscribers.)  |
 |
The good news is that federal government spending has actually flattened out around $3.5 trillion at an annual rate since mid-2009. But that follows a big jump during the previous two years. Let’s have a closer look at the major spending categories:
(1) Income security and Medicaid. Much of the jump and subsequent flattening of federal spending was attributable to spending on “income security” programs such as unemployment benefits and food stamps. On a 12-month basis, this outlay peaked at a record $626 billion during November 2010 and fell to $557 billion last month. While this category should be counter-cyclical because it is a so-called "automatic stabilizer," it remains on a solid upward trend. Federal spending on health, i.e., mostly Medicaid, actually dipped late last year and early this year, but it too remains on an upward trend. It totaled $350 billion over the past 12 months. (2) Defense. Also edging down from last year’s record high is the 12-month pace of defense spending--from a $708 billion peak during September 2011 to $685 billion last month. (3) Social Security and Medicare. Federal spending on income support and medical care for senior citizens remains on a solid uptrend. Together they totaled a record $1.3 trillion over the past 12 months, up 85% over the past 10 years, i.e., since November 2002. (Nominal GDP rose 47% over this same period.) Spending on the health care and income security needs of low-income individuals and households who aren’t old enough to be covered by Social Security and Medicare totaled $907 billion over the past 12 months. We could balance the budget tomorrow if we kept a lid on federal spending and found roughly $1 trillion in additional revenues. Doing so by raising tax rates would crush the economy, depress revenues, and boost income support outlays. The best way to boost revenues is to stimulate economic growth. We’ve already tried to do it with a massive fiscal stimulus program during 2009 and 2010 and ultra-easy monetary policy. Here’s another idea: Let’s postpone the fiscal cliff for a year and see if the economy might grow enough all by itself to meaningfully narrow the deficit. It has done so before. Maybe it can do so again. Today's Morning Briefing: Perpetual Policies & Politics. (1) QE3 + QE4 = ?. (2) Bernanke’s open bar for fiscal drunks. (3) NZIRP now depends on unemployment rate. (4) Too much transparency? (5) The limits of unlimited QE. (6) Bernanke and Obama: Ceaseless campaigners. (7) Washington’s phony wrestling match. (8) BIS says central banks are out of control. (9) Can government spending continue to flatline? (10) Unintended consequences of entitlements. (More for subscribers.)  |
 |
The bond cult is dominated by individual and institutional investors desperate to get some yield north of zero on their fixed-income investments. This is most evident in the monthly mutual fund data compiled by the Investment Company Institute. Over the past 12 months through October, net inflows into bond funds totaled $392 billion; equity funds experienced an $80 billion net outflow. Since the start of the latest bull market in stocks during March 2009, net inflows into equity funds was virtually zero, while bond funds attracted $1.25 trillion.
Nonfinancial corporations have been borrowing money from the bond cult, whose members have been desperately scrambling to lock in yields as the Fed has driven them closer to zero. Over the past four quarters, mutual funds purchased $267 billion in corporate and foreign bonds. To the extent that some of these funds have been used to buy back shares, the bond cult has been financing the bull market in stocks. This was all masterminded by the Fed’s equity and bond cults and implemented with their NZIRP and QE programs. Today's Morning Briefing: The Bond Cult. (1) Lots of corporate cash driving buybacks. (2) Corporate balance sheets are beautiful. (3) The bond cult has lent some cash to the equity cult. (4) The master plan of the Fed’s bond and equity cult. (5) Households have more net worth, including home equity. (6) Are small business owners all Republicans? (7) More job openings and online job ads. (More for subscribers.)  |

|
Corporate treasurers have been driving the bull market in stocks, not retail and institutional investors. The Fed’s Flow of Funds data show that net issuance of corporate equities over the past year through Q3 was minus $274 billion. In other words, buybacks well exceeded gross issues. Nonfinancial corporations registered net buybacks of $419 billion, while the financial sector had net issuance of $119 billion and foreign corporations issued $25 billion, according to the Fed’s data.
The financial sector data include stock issuance by all ETFs, which rose to $174 billion over the latest four-quarter period. Excluding these ETFs, net issuance by financial corporations was minus $55 billion.
The Fed also compiles monthly data for total gross equity issuance. Over the past 12 months through October, corporations raised $152 billion. However, that was overshadowed by buybacks. Data available for the S&P 500 show that they totaled $406 billion over the past four quarters through Q2.
Today's Morning Briefing: The Equity Cult. (1) Bond King gives a eulogy. (2) Resilience of stocks proves that the cult is dead. (3) The cult’s favorite stock is down hard. (4) Cashing in before the cliff boosts capital gains tax rate. (5) Are special dividends propping up the bull? (6) Meet the real equity cult: corporate treasurers. (7) The retail investor has left the equity cult to join the bond cult. (8) The cult at the Fed. (9) The hidden strength in GDP. (10) Highly recommended new App. (More for subscribers.)
 |
 |
China’s Shanghai-Shenzhen 300 has been among the worst-performing stock markets so far this year. However, it jumped 5.0% last week on better economic news out of China. The recent strength in the price of copper was a tipoff to the rebound in Chinese industrial production growth from a recent low of 9.0% y/y during August to 10.1% during November. Retail sales rose at a better-than-expected rate of 14.9% y/y.
Last week’s rally was triggered by China’s new leaders, who spoke about the economy after the meeting of the Communist Party’s politburo. President Xi Jinping signaled a continuation of pro-growth policies and indicated he favored government support for more urbanization.
On the other hand, this morning we learn that China’s exports fell 5.1% m/m last month, while imports edged down by 0.7% (based on seasonally adjusted data). These numbers suggest that global economic growth is weak. However, keep in mind that both have been fluctuating around their record highs since the start of the year. Today's Morning Briefing: Around the World. (1) How much global growth next year? (2) Analysts cutting revenue estimates, but still see growth. (3) European stocks remain on uptrend. (4) China’s new leaders want growth. (5) Euro zone is double dipping. (6) Latest German factory orders upbeat while output is downbeat. (7) Italy and Spain are in deep recessions. (8) Brazil working on opening bottlenecks. (9) US payroll data not too bad. (10) Consumers don’t like the view. (11) Geithner has the power to adjust withholdings. (12) “Hitchcock” (+ + +). (More for subscribers.)  |
 |
Last week, I noted that real GDP on a y/y basis has been growing around 2.0%-2.5% since Q1-2010. That’s subpar. It was up 2.5% y/y during Q3. On the other hand, real output of nonfarm business was up 3.5% during Q3, and has been hovering around 3.0%-3.5% over the same period. Nearly all of the difference can be accounted for by the weakness in government spending.
That’s not a bad development from my perspective. The so-called “New Normal” is actually a combination of abnormally weak government spending on goods and services and relatively normal activity in the private sector. Remove the government (please!), and the economy looks like the Old Normal!
The growth in nonfarm business output since mid-2010 has been driven by relatively stable growth of about 2% in total hours worked in the nonfarm business sector and solid gains in productivity. That’s all good from my perspective. Today's Morning Briefing: Jettisoning the Jitters. (1) Tuning out the bad news. (2) Plenty of good news. (3) Lots of opportunities to make money around the world. (4) A happy scenario for US economy next year. (5) Rising home prices could be very stimulative. (6) Great news: Business output outpacing GDP as government growth weakens. (7) So the New Normal is the Old Normal excluding the government! (8) Record high profits and cash flow. (9) Factory orders rebounding thanks to record profits. (10) No cliff jitters in latest NM-PMI. (More for subscribers.)  |
 |
Among the S&P 500 sectors, Energy’s hay days were during the 1970s, when oil prices soared during the oil crises of 1973 and 1979. This sector and the Materials sector were volatile market performers during the 1980s and mostly underperformers during the 1990s, when IT massively outperformed all the other sectors, especially these two.
During the previous decade’s bull market, these two sectors significantly outperformed the others. Driving them higher both in absolute and relative terms was the perception that the emergence of the emerging economies, led by the BRICs (and especially China), set the stage for a commodities “super-cycle.” Their underperformance during the current bull market suggests that they might not be so supercharged anymore as structural debt problems around the world weigh on global economic growth. Going over the fiscal cliff would certainly weigh heavily on these two sectors next year. In any event, the prospects for global economic growth remain subdued, so they are likely to remain underperformers for a while in any case. Today Morning Briefing: Relative Performance. (1) Sorting out the patterns. (2) Consumer Discretionary stocks tend to be early cycle outperformers, but may continue to do so later this time. (3) Not too many outperformers among Consumer Staples. (4) Health Care can be a late cycle bloomer. (5) Financials should outperform, but may remain on rollercoaster in cliff scenario. (6) Energy and Materials unlikely to outperform if global growth remains weak. (7) Fracking should continue to inflate Industrial Gases and Specialty Chemicals. (8) Industrials may be market performers for a while. (9) New technologies may be commoditizing IT and weighing on sector’s stocks. (More for subscribers.)  |
 |
For the past four years, a prime concern among investors was the possibility of a financial meltdown in Europe similar to the one that followed the collapse of Lehman in the US. ECB President Mario Draghi alleviated that widespread fear in late July of this year when he promised to do “whatever it takes” to defend the euro. Since then, the Europeans seem to be making some progress in cleaning up the Euro Mess.
Last week, the finance ministers of the 17 EU countries in the euro zone agreed to give Greece the next installment (€44.6 billion) of its €240 billion in rescue loans--of which the country has received about €150 billion so far. The ministers reduced the interest rate charged for the loans by 100 basis points and agreed to a 15-year extension of their maturity. The deal allows Greece to avoid an imminent default and reduces the odds of the dreaded Grexit. However, Christine Lagarde, the managing director of the IMF, warned that the Fund would not approve the next disbursement of aid to Greece unless more loans were provided for Greece to enable it to buy back its debt at a discount.
Yesterday’s FT reported that the Greek government didn’t waste any time: “Greece has launched an aggressive debt buyback programme using up to €10bn of eurozone funds, hoping it will be enough for an international deal on a wider package that secures its place in the eurozone. By paying a bigger-than-expected premium over previous market prices for Greek bonds held by private sector investors, which are trading well below their face value, Athens could retire more than €20bn of its debt mountain after costs.” The 10-year Greek government bond yield has plunged from this year’s high of 43.9% on March 8 to 14.6% this morning. Also yesterday, Spain made a formal request for about €40 billion from the euro zone's bailout fund to recapitalize its banks, well under the maximum amount of €100 billion authorized by the euro zone to recapitalize Spain’s banks. The request was approved. Today, finance ministers from all 27 EU governments will push for a deal on the setup of a new bank supervisor for the euro zone by January 1. Euro zone governments previously agreed that the creation of the supervisor must be a condition for allowing the bloc's bailout fund to pump capital directly into the region's banks. News of the Greek buyback plan helped extend last month’s rally in other euro zone “periphery” countries’ bonds. This morning, the Italian 10-year government bond yield is down to 4.40%, a two-year low. The Spanish 10-year yield is down to 5.20%, the lowest since March. The Europe FTSE Eurosfirst 300 Banks Euro Index has rallied to a new high for the year in recent days. Also encouraging is that TARGET2, the ECB’s payments system, is showing that capital stopped pouring out of Spain, Italy, and Portugal in the past few months through October. Today's Morning Briefing: Two Steps Forward. (1) The market has ADD. (2) Always something to worry about. (3) No Grexit for now. (4) Did you buy any Greek bonds at 40%? (5) Spanish banks get some rescue funds. (6) European financial indicators are upbeat. (7) TARGET2 showing less capital fright. (8) Now there are two plans to avert the fiscal cliff. (9) Let’s split the difference, and go on vacation where there are no cliffs. (10) The storm vs. the cliff. (More for subscribers.)  |
 |
Our “Stay Home” investment theme outperformed the “Go Global” alternative all year until the November 6 US election results raised the odds that the US might fall off the fiscal cliff after all. The S&P 500 dropped more than overseas markets during the first half of November. The performance gap remained narrower than it had been during the rally in global stock markets during the second half of the month. The S&P 500 is up 12.6% ytd, while MSCI Europe is up 10.3% and MSCI Emerging Markets is up 9.7%.
Leading the way this year in Europe is Germany, which is up 25.6% ytd. Among the emerging economies, India’s stock market is also outpacing most of the rest with a gain of 25.1% ytd. (However, Pakistan's is up 46.1%, and the Philippines' is up 28.6%.) China is one of the worst performers this year with a drop of 8.8%, making a new low for the year last week. Yet there have been significant rallies during November in Taiwan (7.2%), Singapore (16.0%), and South Korea (5.9%). What are the markets telling us? Here are a few possibilities:
(1) Germany’s outperformance suggests that investors believe that even if Europe remains in a recession, it will be moderate. (This morning we learn that the euro zone’s M-PMI remained weak at 46.2 in November, but up from 45.5 in October.) In addition, it suggests that German companies will find enough growth globally to offset weakness in the euro zone. Meanwhile, despite all the recent commotion about Greece and Spain, Spanish and Italian government bond yields have dropped sharply in recent days, down to 5.17% and 4.39% this morning. Also impressive is that the FTSE Eurofirst 300 Banks Euro Index rose to a new high for the year last week. (2) China’s underperformance may reflect a growing perception that China’s belligerent territorial claims in the South China Sea may drive foreign direct investment, especially from Japan, elsewhere. Maybe that’s why other Asian bourses are outperforming. Until this summer, when the territorial disputes heated up, China’s stock market had tended to be highly correlated with the price of copper, which actually rallied strongly last week. China’s economy is growing, as evidenced by the surprisingly strong 20.5% y/y increase in industrial profits during October. China’s official manufacturing PMI rose to a seven-month high of 50.6 in November from 50.2 in October. (3) India’s outperformance partly reflects the government’s recent moves to reform the economy, which is showing signs of faster growth. This morning, Reuters reports, “India’s manufacturing sector beat the expectations of economists to grow at its fastest pace in five months in November, boosted by strong export orders and a surge in output, a business survey showed on Monday. The HSBC manufacturing Purchasing Managers’ Index (PMI), which gauges the business activity of India’s factories but not its utilities, rose to 53.7 in November from 52.9 in October.” Today's Morning Briefing: Aloha! (1) Hawaiian vacation. (2) Geithner offers to cut spending by $1 for $4 of taxes. (3) McConnell laughs, while Boehner cries. (4) Pelosi and Cantor both say: “We won.” (5) Cocky Dems expect GOP to cave. (6) Will Nero surf while Rome dives? (7) The market is bipolar, with more upside on deal than downside on no deal. (8) Why are Germany and India outperforming while China is underperforming? (9) Ups & downs in GDP. (10) "Silver Linings" (+). (More for subscribers.)  |
 |
Under Fed Chairman Ben Bernanke, the Fed has been the great enabler of Washington’s fiscal excesses of the past few years. The Fed’s quantitative easing blurs the line between fiscal and monetary policies. The Fed may still be politically independent, but fiscal policy has become very dependent on the willingness of the Fed to purchase lots of government securities. A consolidated statement of the US Treasury and the Fed would show that $1.7 trillion of US government debt, which is held at the Fed, is costing the government only 0.25%.
In yesterday’s WSJ, Jon Hilsenrath reported that the FOMC is likely to vote for QE4 when the committee meets on December 11-12. In September, the FOMC implemented QE3, i.e., an open-ended commitment to purchase mortgage-backed securities at the rate of $40 billion per month. The Fed’s Operation Twist is scheduled to terminate at the end of the year. Under this program, the Fed purchased $45 billion a month in long-term Treasuries, paying for them with the proceeds from its holdings of short-term debt.
Now some members of the FOMC are pushing for more purchases of Treasury bonds. However, the Fed is running out of short-term securities to sell. Hence, QE4! As Hilsenrath observes: “The Fed has run down its stockpile of the short-term Treasurys to sell to fund long-term purchases. To keep buying the long-term bonds it would need to fund the purchases by creating new bank reserves, which in effect is printing money. That is how the Fed has funded previous Treasury purchase programs and how it is funding the mortgage-bond buying. Though critics say this could be especially inflationary, many Fed officials believe they can manage the reserves without risking inflation.” Even more generous than the Fed have been foreign central banks. Their holdings of US Treasuries rose to a record $2.9 trillion during the week of November 7. Let’s face it: A deal to fix the fiscal cliff won’t fix our structural deficit problem. Washington will probably avert the cliff, but continue to run insane deficits. The Fed and other central banks will continue to enable this insanity by purchasing lots of US Treasuries. Eventually, this may lead to inflation. However, the more likely scenario is that our kids will be buried under all the debt that we are leaving them. We may get a stay of execution, but the next generation won’t. Today's Morning Briefing: Fiscal Facts & Fantasies. (1) Death row and the cliff. (2) When Harry met John. (3) Beige Book is blue about cliff. (4) There’s a not-so-grand bargain in the works. (5) Tax the rich! Many are Democrats. (6) Another apocalypse-postponed rally ahead. (7) The Treasury bond crop never fails. (8) Averting the cliff should boost growth and narrow the deficit. (9) Believe it or not: Federal spending flat for over 3 years. (10) Here comes QE4 on top of QE3. (11) Sticking it to the next generation. (More for subscribers.)  |
 |
Earlier this year, there was widespread concern about the slowdown in US economic growth. Real GDP rose 2.0% (q/q saar) during Q1 and only 1.3% during Q2. The preliminary official estimate for Q3 edged back up to a still anemic 2.0%. That triggered some chatter that the economy was too close to “stall speed.” There were similar concerns expressed during 2010 and 2011.
In the past, whenever the y/y growth rate of real GDP fell below 2.0%, a recession followed. That strongly suggests that rolling a pair of snake eyes is bad luck for the economy. Last year’s low was 1.6% y/y during Q3. So far this year, the lowest reading was 2.1% y/y during Q2.
Yet the economy is still chugging along. On Thursday, Q3’s real GDP is likely to be revised up significantly to 2.8% (q/q saar), according to the latest consensus of economists compiled by Bloomberg. That would put the y/y growth rate at 2.5%.
Today's Morning Briefing: Snake Eyes. (1) Stall speed? (2) Real GDP still chugging along around 2%. (3) Upward revision. (4) Will storm surge offset fiscal cliff? (5) Paying dividends. (6) Consumers continue to do what they do best. (7) Optimism is in season. (8) Intermodal railcar loadings at record high. So are inventories. (9) Capital spending is a drag. (More for subscribers.)  |
 |
The good news is that industry analysts may be ready to take a rest over the rest of the year after cutting their S&P 500 earnings expectations during October’s Q3 earnings season. They continued to lower their estimates for Q4 during the week of November 22, but they did less of that for the four quarters of next year.
Their 2013 estimate edged down last week, but should start to stabilize around $113 through the end of the year and until the next earnings season during January. For industry analysts, the long term is 2014, and their estimate for that year edged up to $127 last week, a projected increase of about 12% y/y. So while forward earnings are showing signs of stalling recently, they should be moving to new highs again if 2014 estimates hold up. Today's Morning Briefing: Woe Is Us! (1) The bull gets no respect. (2) Will the bull hit the wall or climb it if we fall off the cliff? (3) Why Bill Gross is wrong about the death of the equity cult. (4) Professor Gordon’s new normal on life support. (5) Was the old normal really abnormal? (6) The fourth industrial revolution. (7) Grantham’s Malthusian musings. (8) Reinhart-Rogoff again. (9) Bullish contrarians should be delighted. (10) Earnings outlook remains bright despite recent estimate cuts. (11) “Lincoln” ( + + +). (More for subscribers.)  |
 |
Friday’s 1.3% rally in the S&P 500 (along with comparable jumps in other stock markets around the world) was triggered by good news out of Germany. The Ifo economic institute's closely watched business climate index rose to 101.4 in November from 100.0 a month earlier. That’s after falling for six months amid the euro zone's debt crisis. It defied expectations of a renewed downturn in November as both the assessment of current conditions and business expectations for the coming six months recovered.
The improvement was led by wholesalers (from -3.2 to 4.9), retailers (from -5.8 to -0.6), and construction (from -11.8 to -7.5). The outlier was services, which fell from 9.1 to 8.5. This is consistent with the latest readings from Markit’s survey of German purchasing managers.
Today's Morning Briefing: (1) Is the correction over already? (2) Bears should think twice. (3) A yearend rally to a new 2012 high? (4) Is it the season or the fundamentals? (5) A series of relief rallies. (6) Consumer Discretionary stocks take the lead again. (7) Good news out of China, Germany, & US. (8) China’s PMI back above 50. (9) Germany’s Ifo upticks. (10) US real GDP could be revised closer to 3% during Q3. (11) “Life of Pi” (+ +). (More for subscribers.)  |
 |
Our Second Recovery scenario for next year received a lift from November’s Housing Market Index, which was reported yesterday by the National Association of Home Builders (NAHB). It rose to 46 last month, the highest reading since May 2006. It is highly correlated with single-family housing starts. The NAHB’s index of traffic of prospective home buyers was unchanged at a 6½-year high of 35, up 17 points since April.
Existing homes sales rose 2.1% during October after falling 2.9% during September, and remain on a slow uptrend. Helping to boost demand is that single-family home prices are starting to move higher. The median price rose 10.9% y/y during October, the fastest pace since January 2006. Rising home prices should revive long-dormant buy-in-advance attitudes in the housing market.
The recovery in home prices is helping to boost consumer confidence. Imagine all the homeowners who have negative homeowners’ equity, which may be turning less negative. Some of them might be able to refinance their mortgages. In early November, the Consumer Sentiment Index jumped 2.3 points to 84.9, the highest since July 2007. This improvement was confirmed by the recent strength in the Bloomberg Consumer Comfort Index.
Today's Morning Briefing: Thanksgiving. (1) Count our blessings. (2) Second Recovery scenario gets a lift from homebuilders. (3) Existing home prices up more than 10%. (4) Consumer confidence still rising in November. (5) Energy independence for the US. (6) So why is capital spending depressed? (7) The US economy is a coiled spring. (8) Risk On/Off and all that jazz. (9) What if falling off the cliff is off? (10) There’s still some energy in the global economy. (More for subscribers.)  |
 |
The S&P 500 fell 1.4% last week, ranking in the middle of the 41 stock markets we monitor in a week when just six markets rose. The S&P 500’s performance last week tied or outperformed all the major MSCI indexes. Their performances from best to worst: MSCI EAFE (-1.4%), MSCI World (-1.5), MSCI Emerging Latin America (-1.6), MSCI Emerging Asia (-1.7), and MSCI Europe (-2.6). The S&P 500’s 3.7% decline so far in November ranks 35th of the 41 markets. Year to date, the S&P 500 (8.1) is ahead of all the MSCI indexes including MSCI World (6.4), but its ytd ranking has slipped to 20th from 5th since the beginning of October.
Today's Morning Briefing: Turbulence & Trouble. (1) Anna Karenina, Lincoln, and the human condition. (2) T&T can be explosive sometimes. (3) Is the bull’s run over? (4) Deal or no deal in DC? (5) Kicking Greece down the road again. (6) Xi is a Party boy. (7) Time to bomb Fordo? (8) Iron Dome anti-missile defense system is a game changer. (9) Defense isn’t working in S&P 500. (More for subscribers.)  |
 |
The Euro Mess remains as messy as ever. However, investors have been less concerned about a financial meltdown in Europe ever since ECB President Mario Draghi volunteered at the end of July to do whatever it takes to avert a euro cliff. Furthermore, the Europeans continue to kick Greece down the road rather than force it out of the euro zone. Nevertheless, Europe is sinking deeper into a recession. That’s becoming a more significant concern to investors I’ve talked with recently, especially if the US economy falls off the fiscal cliff.
Particularly unsettling yesterday were massive and widespread anti-austerity protests across Europe. The strikes and demonstrations, some involving hundreds of thousands of people, hit more than 20 countries in the EU, disrupting airports and ports, closing roads and public transportation, and shutting some essential services. The biggest protests were in Portugal, Spain, Greece, and Italy. The union-led protests--called "European Day of Action and Solidarity"--were mostly peaceful, but turned violent in Lisbon, Madrid, and Rome. September was a bad month for European output. Industrial production in the euro area fell 2.5% m/m, with sharp declines in Germany (-2.1), France (-2,7), Italy (-1.5), and Spain (-5.1). During the month, there were also big drops in Greece (-9.0), Portugal (-12.0), and Ireland (-12.6). Output in the UK has been hovering around its lows of early 2009 for the past few months. Today's Morning Briefing: Foul Mood. (1) It isn’t personal; it’s business. (2) Obama raises the ante. (3) Anti-austerity protests in Europe. (4) Friedman’s nightmare scenario for the Middle East. (5) QE4 to the rescue? (6) The market’s post-election vote is thumbs down. (7) Maybe it’s not as bad as it feels. (8) Recessions are popping up around the world. (9) There’s still growth in the US, China, Mexico, and Indonesia. (More for subscribers.)  |
 |
The S&P 500 is down 6.2% from the year’s high of 1465 on September 14. It is up 9.3% ytd. It could certainly rebound 6.6% back to the year’s high if the fiscal cliff is averted. I’m not sure that there’s enough time to do much better than that. So breaking out to a new record high may have to wait until next year.
Once again 13 is turning out to be an unlucky number for the forward P/E of the S&P 500. The latest and the previous two rallies in the S&P 500 since mid-2010 hit a brick wall when the P/E rebounded back to about 13. Since peaking at 13.1 on September 14, the P/E has dropped to 12.3. Over this same period, the forward P/E of the S&P 400 MidCaps fell from 14.8 to 14.0, and the S&P 600 SmallCaps forward P/E dropped from 15.9 to 14.4.
The market hit the year’s high the day after the Fed announced QE3 on September 13. The rally stalled as investors awaited the Tuesday, November 6 election results. The S&P 500 is down 3.8% since last Tuesday's close, after investors apparently concluded that the odds of going over the cliff had just increased. If that doesn’t happen, stocks are cheap and the P/E could easily rebound, maybe even above 13. If it does happen, the previous low for the P/E was 10.2.
Today's Morning Briefing: A Review. (1) Running out of time for yearend rally. (2) Once again, 13 is unlucky for P/E. (3) Stocks are cheap again as long as cliff is averted. (4) FSMI dipping. (5) Commodity prices weaker, while dollar stronger. (6) Sentiment turning more bearish. (7) Dow Theory in neutral. (8) Yellen endorses latest super-easy money idea. (9) Hard to see QE3 in Fed’s balance sheet. (More for subscribers.)  |
 |
Before we examine the microeconomics of earnings, let’s have a look at the macro picture. It’s surprisingly upbeat currently. Now that profit margins are back at previous cyclical highs, earnings will be driven by revenues, as long as margins hold steady. S&P 500 revenues per share is highly correlated with manufacturing and trade sales in the US, which jumped 2.8% over the past three months to a record high during September. The y/y growth in business sales is up 4.4%, edging up from a recent low of 2.8% during July.
There are lots of potential shortcomings with this macro analysis. US business sales are limited to goods. The data do not include sales of services. A significant portion of S&P 500 revenues comes from abroad. The business sales series does capture merchandise exports, which are also highly correlated with S&P 500 revenues. Exports rose to a new record high during September as well. However, revenues generated by sales of goods and services produced abroad by S&P 500 companies are not reflected in either US business sales or US merchandise exports.
With the global economy depressed by a recession in Europe and slower growth in emerging economies, the strength in US macroeconomic data has been offset by weakness abroad. That’s clear from the 90% of S&P 500 companies reporting so far that their Q3 revenues fell 1.5% y/y. A resolution of the US fiscal cliff before the end of the year should set the stage for a rebound in revenues and earnings growth to 6%-8% next year. If we go over the cliff, all bets are off. Today's Morning Briefing: Earnings Cliff Too? (1) Analyzing the analysts. (2) Earnings Tuesday and Revenues Thursday. (3) Downward slope rather than cliff. (4) Micro vs. macro earnings. (5) Surprisingly upbeat macro picture. (6) US business sales and exports at record highs! (7) Lots of downward trends among earnings estimates. (8) However, S&P 500/400/600 forward earnings at or near record highs. (9) Chopping quarterly estimates through next year. (10) The big losers are Industrials, IT, and Materials. (More for subscribers.)  |
 |
The good news is there is some good news coming out of China. Since 2010, the Three Horsemen of the Apocalypse have been a double-dip recession in the US, a financial meltdown in Europe, and a hard landing in China. If the fiscal cliff is averted in the US, the prospects for the US economy are reasonably good in 2013. But first, it must be averted.
The Euro Mess is as messy as ever. However, bond yields have remained relatively low in Spain and Italy thanks to ECB President Mario Draghi’s promise to provide unlimited liquidity to both countries as soon as they ask for bailout funds from the European Stability Mechanism, and accept its conditions. So far, neither country has even asked for help from the ESM.
China seemed to be heading toward a relatively hard soft landing during the summer. Beijing responded with a mini-stimulus, cutting interest rates twice in June and July and stepping up investment by state companies and spending on building airports and other public works. Chinese data released for October suggest that the recent round of monetary and fiscal stimulus may be working:
(1) Industrial production rose 1.4% m/m and 9.6% y/y to a new record high. Retail sales rose 14.5% y/y. Auto sales rose 6.4% to 1.3 million vehicles, rebounding from September’s 0.3% contraction. Investment spending rose 25.2% y/y.
(2) Exports rebounded 2.1% m/m during October, very close to the record high earlier this year during May. This is an encouraging development since it confirms our view that the global economy may be slowing, though still growing. Also on the upbeat side was the 6.1% m/m increase in imports.
The rebound in Chinese exports during October was led by a 2.1% increase in exports to the rest of the world, i.e., the total excluding the US, EU, and Japan. These exports now account for a record 61% of China’s exports, up from 50% six years ago. China’s recent dispute with Japan may account for some of the weakness in trade between the two over the past couple of months. However, China’s exports to Japan are down to only 7.2% of the country’s total from about 16% 11 years ago.
Today's Morning Biefing: Thelma & Louise & Paul. (1) Big win for Big Brother. (2) Romney’s bad numbers. (3) Majority rules. (4) The government has lots of supporters, who get support. (5) Krugman ready to take a dive. (6) Kristol says not so fast. (7) Deal maker: Closing loopholes. (8) The rich should expect to pay more. (9) Cliffhangers in Connecticut. (10) China not ready to land. (11) “Skyfall” (+ +). (More for subscribers.)
 |
 |
The first four years of Obama were very bullish for the stock market. The S&P 500 rose 66% from January 2009 through October 2012, using monthly averages of daily closing data. That compares very favorably to the 50% average of the first terms of the past 11 presidents starting with FDR. The S&P 500 rose 16% during the second terms of the past six presidents who were reelected.
Yesterday’s 2.4% drop in the S&P 500 instantly discredited the widely held view that the initial response to an Obama victory would be bullish because the Fed would remain free to pursue QE3 for at least another four years. Fed Chairman Ben Bernanke is now likely to be reappointed in early 2014 for another four-year term if he wants to keep his job. If not, he’ll be replaced by a like-minded successor. Today’s WSJ lists the usual suspects who would make good Bernanke clones, including Janet Yellen, Don Kohn, Roger Ferguson, Alan Blinder, and Larry Summers. So why the Bronx cheer from investors?
Today's Morning Briefing: Nothing to Fear, But… (1) The meaning of life: A full tank of gas. (2) Bully for Obama. (3) Bernanke’s clones. (4) Is Washington running on empty? (5) The Thelma-and-Louise scenario. (6) ObamaCare’s unintended consequence. (7) Why do Republicans coddle rich Democrats? (8) Apocalypse now, postponed, or never? (9) Europe’s slippery slope. (10) Fretting about revenues. (More for subscribers.)  |
 |
President Barack Obama faces lots of issues around the world that pose significant risks to the US economy. The fiscal cliff may actually be the easiest one to deal with if a deal can be struck between the Democrats and Republicans.
Making deals to peacefully resolve the conflicts between Israel and Iran, China and Japan, and the already warring factions in Syria could be much more challenging. If any of these conflicts worsens, the global economic expansion potentially could be disrupted. For now, the global economy is growing, though at a slow pace on balance, despite the recession in Europe. Let’s review: (1) US and China. The latest batch of US economic indicators for October confirms that the US economy continues to grow at a leisurely pace despite fears that growth could stall. We reviewed Friday’s better-than-expected employment data on Monday. Yesterday, we reviewed the PMIs, which are all above 50. Moving above 50 for the first time since July was China’s M-PMI during October, but just barely to 50.2. China’s NM-PMI was stronger last month, rising to 55.5 from 53.7 the previous month. Elsewhere in the Asia-Pacific region, Indonesia’s real GDP growth held above 6% for an eighth quarter as domestic consumption and rising investment countered an export slump. (2) Europe. On the other hand, German factory orders fell by 3.3% during September. Foreign orders tumbled by 4.5%, led by a plunge of 9.6% in orders from the euro zone. Domestic bookings dropped by 1.8%. The area's recession is starting to spread into the strongest economy in the euro zone. That’s confirmed by the latest M-PMIs, with the one for Germany falling 1.4 points to 46.0 (a two-month low). France’s index (43.7) remained around September’s 41-month low of 42.7, and Italy’s M-PMI dropped to a 40-month low of 45.5. Today's Morning Briefing: Another Storm. (1) Still powerless. (2) Hello again from MiFi. (3) Noah has left the neighborhood. (4) Storm surge vs. fiscal cliff. (5) Still in power in DC. (6) This too shall pass. (7) Despite disappointments, earnings estimates are holding up. (8) They are falling for Materials, IT, and Industrials. (9) Earnings outlook improving for Financials and Telecom. (10) “Stay Home” rather than “Go Global” for another year? (More for subscribers.)  |
 |
Will the storm surge offset the fiscal cliff? Let’s think outside the box for a minute, very far outside the box. Let’s assume that there is no deal on either postponing or fixing the fiscal cliff problem. Everyone knows that this will cause a recession at the beginning of next year. Government spending will be cut, and taxes will go up. That’s certainly going to push the economy over the edge.
Are we sure about that? Maybe this is the only way we can actually make progress in reducing the deficit. Perhaps the initial recessionary impact of going over the cliff will be offset by lots of spending early next year attributable to the recovery from Hurricane Sandy. In this scenario, real GDP might continue to grow early next year with the “Second Recovery,” giving the economy a boost all of next year. Granted, this may be too farfetched for the wailing chorus of fatalistic doomsayers. For now, the US economy is continuing to grow at a slow, but steady pace:
(1) Payroll employment. The growth in payroll employment on a year-over-year basis has been exceptionally steady, hovering around 1.5% for about a year. On the other hand, private-sector wages are up just 1.6% y/y, with the wages of nonsupervisory production workers up just 1.1%, the lowest on record. Then again, productivity rose 1.5% y/y during Q3, with unit labor costs up just 1.1%. That’s good for profits, and profitable companies tend to expand by hiring more workers. (2) Purchasing managers indexes (PMIs). October’s M-PMI edged up from 51.5 during September to 51.7. The NM-PMI edged down to a still respectable 54.2 during October from 55.1 the month before. These moves were led by an encouraging jump in the M-PMI’s new orders index from 52.3 to 54.2 in October, while the NM-PMI’s new orders index declined from 57.7 to a still solid 54.8. (3) Employment PMIs. Friday’s employment report was certainly full of good news, as I discussed yesterday. So was yesterday’s NM-PMI employment index, which rose from 51.1 in September to 54.9 in October. On the other hand, the M-PMI employment index fell from 54.7 to 52.1. The average of the M-PMI and NM-PMI employment indexes edged up from 52.9 in September to 53.5 in October. Today's Morning Briefing: May the Best Man Win. (1) Who will be more bullish or bearish for stocks? (2) Romney will let Bernanke retire. (3) Fiscal cliff: Deal or no deal? (4) Is it really such a big deal? (5) Storm surge could offset fiscal cliff. (6) US economy growing despite dire warnings. (7) Lots of geopolitical challenges for global economy. (8) Not much growth around the world. (9) German orders: Das is nicht gut. (More for subscribers.)  |
