Wednesday, March 30, 2011

Equity & Bond Mutual Funds


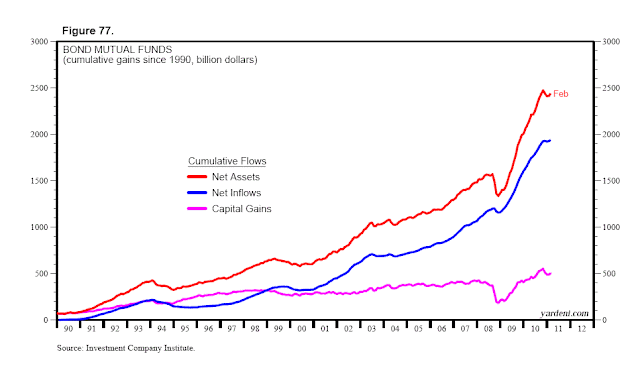
 What are individuals doing now? Over the past three months through February, they purchased $72 billion in equity mutual funds and $9.3 billion in bond funds. The equity inflows represent the best three-month total since February 2007. The bond inflows represent the worst three-month total since late 2008, just before individual investors went on a bond-buying binge during 2009 and most of 2010.


What did individual investors do during one of the greatest two-year equity bull markets in history? They bought bonds. Their cumulative net inflows over the past 24 months through February were $737.7 billion into bond funds and $119.5 billion into equity funds. (We update these charts for subscribers to our service in our Mutual Funds briefing book.)


Consumer Confidence Index


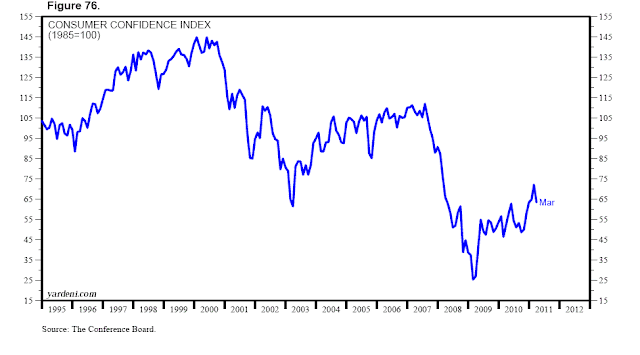
The Conference Board's CCI fell for the first time in six months, dropping to 63.4 in March. It improved steadily from 48.6 in September to a cycle high of 72.0 in February, which was above the 70.4 preliminary figure.

The Expectations component of the CCI dropped by 16.4 points in March to 81.1, after increasing steadily from 65.5 in September to a six-year high of 97.5 in February. The Present Situation component rose for the sixth straight month, from 23.3 in September to a 28-month high of 36.9 in March. It was at a 27-year low of 20.2 at the end of 2009.

Monday, March 28, 2011

Earned Income in Personal Income


While working stiffs are hanging on to record real pay despite rising food and energy prices, there are fewer of them relative to just plain stiffs. The ratio of payroll employment to the working-age population fell to 54.6% during February, the lowest since April 1985. It is down from a record high of 62.5% during December 1999.


Wages and salaries in personal income fell to a record low of 50.5% of personal income during February. It’s down from about 65% during the 1960s. Total compensation, which includes benefits, fell to a record low of 63.0% of personal income during February. It was over 70% during the 1960s.


NIPA Corporate Profits and Cash Flow


One of the most important reasons to be optimistic is that corporate profits remain in a super-normal recovery. That’s been my main theme for the past two years. It still is, because it is still working. Last week, the Commerce Department reported some record breaking results for profits in the National Income & Product Accounts (NIPA) during Q4-2010. After-tax corporate profits from current production--i.e., on a cash flow basis reflecting inventory valuation and capital consumption adjustments (IVA and CCA)--rose to a record $1,250.2 billion (saar). It is up 61.4% from the most recent cyclical low during Q4-2008. It is 7.9% above the previous cyclical peak during Q3-2006. Undistributed profits with IVA and CCA rose to a record $504.8 billion (saar), up sharply from the most recent cyclical low of -$2.9 billion during Q4-2008. Dividends totaled $745.4 billion, up 6.5% from the most recent cyclical low during Q3-2009.
Economic depreciation edged up to $1,029 billion. Including the CCA, tax-reported depreciation rose to a record $1,013.3 billion. Corporate cash flow, which is equal to retained earnings plus tax-reported depreciation, rose to a record $1,535 billion at the end of last year. That’s up $498.9 billion, or 48.2%, from the most recent cyclical low during Q4-2009. It exceeds the previous cyclical peak during Q1-2006 by 10.5%. 


Wednesday, March 23, 2011

Fundamental Stock Market Indicator


We continue to closely monitor the relationship between the S&P 500 and our Fundamental Stock Market Indicator (FSMI). The two have been highly correlated over the past 10 years. They both remain on their solid upward trends of the past two years, though they’ve both stalled so far this month. That’s not surprising given recent events in the Middle East and Japan. The same can be said for the CRB raw industrials spot price index, which is one of the three components of our FSMI. Again, that’s not surprising under the circumstances.


The CRB raw industrials spot price index is our favorite indicator of global economic activity. It is highly correlated with measures of global industrial production and the volume of world exports. We like it because it includes 13 industrial materials prices and excludes energy and wood commodities. The index rose to a record high of 625.2 on March 4. It was down 3.1% from that high on March 16, and on March 22 was back to 620.6, only 0.7% below the peak. Our trusty CRB index includes the price of copper, which is our favorite of the 13 components in the CRB index. Copper hit a record high of $4.62 a pound on February 14. It is trading at $4.38 this morning. This year’s low was $4.13. We view $4 as key support. A drop below that, if confirmed by a break in the CRB index, would shake our confidence in the resilience of the global economy. 

Monday, March 21, 2011

Was QE-2.0 Necessary?


QE-2.0 was explicitly aimed at boosting stock prices to create a positive wealth effect on the economy. I don’t think that was necessary given the great recovery in corporate earnings. While I love bull markets, I prefer organically grown ones rather than Fed-inflated bubbles. What’s done is done, and the Wilshire Index is up $6.9 trillion over the past two years, with $2.6 trillion of this gain occurring since August 27, 2010, when Fed Chairman Ben Bernanke first raised the possibility of a second round of quantitative easing. In my scenario, the wealth effect should continue to boost the economy this year.


QE-2.0 has weakened the dollar, which is boosting exports. Fed officials have denied that QE-2.0 was designed to weaken the dollar. However, the trade-weighted dollar is down 6.0% since the end of August 2010, when Mr. Bernanke first raised the possibility of QE-2.0.

Sunday, March 20, 2011

US Business Cycle Indicators


The employment cycle seems to be tracing out an old normal recovery. This is clearly the case for initial unemployment claims, which are repeating the typical pattern of going straight up during recessions and straight down during recoveries. The four-week average peaked at 643,000 during the week ending April 4, 2009. It has been just below 400,000 for the past three weeks. Claims might have fallen faster but for the onslaught of regulatory meddling from Congress during the past two years. That all stopped following the “regime change” during last year’s elections. I believe that the election results convinced profitable companies to proceed with expanding their payrolls, as they always have in the past when profits improved.


Global manufacturing is booming. That’s obvious in the data coming out of some of the world’s manufacturing power houses, such as Germany and South Korea. It is becoming increasingly obvious that US factories are also participating in the boom. The January and February surveys of manufacturing purchasing managers conducted in the US by the Institute of Supply Management (ISM) were surprisingly robust. The March survey could be even stronger based on the latest survey of manufacturing in the region around Philadelphia, where the diffusion index of current activity increased from 35.9 in February to 43.4 this month. This is the highest reading since January 1984!


Wednesday, March 16, 2011

Bond Yield Model

This simple bond model compares the 10-year Treasury bond yield to the growth rate of nominal GDP. During the 1960s and 1970s, the yield traded consistently below the y/y growth in nominal GDP. It was the BBV Era, i.e., the time before Bond Vigilantes. During the 1980s through the mid-1990s, the Bond Vigilantes were much more vigilant about the threat of inflation, and the yield usually exceeded nominal GDP growth. During the second half of the 1990s, the Bond Vigilantes turned less vigilant as they became less concerned about inflation. The yield was very close to nominal GDP growth. The bond yield fell to a record low during late 2008 and remained low in 2009 when nominal GDP growth turned negative. At the end of last year nominal GDP growth was 4.1%, and the yield has been trading below that rate so far this year.


Japan's Electricity Usage


The fact is that Japan’s economy, the third largest in the world, is in big trouble. The country’s Federation of Power Companies provides monthly data on electric power consumed by large users. It rebounded 25.7% from a cyclical low of 19.4 billion Kwh during March 2009 to 24.3 billion Kwh during January 2011. That was still 5.3% below the record high during February 2008. By some accounts, Japan’s electricity output may now be down by at least 25%. That would put usage by large users back at a recession reading of around 18.0 billion Kwh.

Tuesday, March 15, 2011

S&P 500 Weekly Earnings

The market’s remarkable resilience to bad news reflects the extraordinarily steady advance in S&P 500 forward earnings. Industry analysts simply haven’t flinched so far. They rarely flinched as forward earnings rose during 49 of the 52 weeks of 2010. Forward earnings has been up every week of this year so far. The consensus estimate of analysts for 2011 rose to a new high of $97.75 per share during the week of March 11. Their 2012 estimate edged up to $111.22.
Investors haven’t flinched much either so far this year. The S&P 500 forward P/E edged down to 13.0 during the week of March 11, down slightly from the year’s high of 13.6 during the week of February 18. Last year, investors flinched noticeably when the P/E dropped from 14.3 at the end of April to 11.5 in early July.

Sunday, March 13, 2011

World Trade

Despite all the chatter about double dips, government debt crises, and asset bubbles, the volume of world exports rose to a new record high at the end of last year. This data series, which is compiled by the Netherlands’ Bureau for Economic Policy (CPB), is very highly correlated with the OECD’s measure of global industrial production, which hit a new record high at the end of last year. We update this chart regularly for subscribers in World Trade Alert.

The world exports series is also highly correlated with the CRB raw industrials spot price index, which is also at a record high. These three measures all attest to the resilience of the global boom.


Thursday, March 10, 2011

US Petroleum Inventories

We monitor US crude oil and gasoline inventories by comparing this year's weekly data to the same weeks during the past four years, i.e., 2007-2010. During the week of March 4, crude oil stocks were at 348.9 million barrels, about the same as two years ago. Amazingly, according to the latest CFTC's Commitments of Traders report, Large Speculators have acquired options to purchase 78% of this entire inventory during the week of March 1, when they held a record 271.9 million barrels in WTI crude oil futures contracts. The latest US petroleum inventories data pushed the price of WTI crude oil down $1.06 the past two sessions to $104.38 yesterday. However, Brent rose $2.31 to $115.46 yesterday.
During the week of March 4, gasoline stocks totaled 229.2 million barrels. That's about as much as a year ago.

Tuesday, March 8, 2011

Bullish Fundamental Indicators

If the market continues to rally despite the turmoil in the Middle East, it will be because the US economic expansion is showing more signs of strengthening. The latest evidence of that is January’s survey of small business owners, as discussed below. Even more impressive is the recent vertical ascent of our Fundamental Stock Market Indicator, which has been very closely correlated with the S&P 500 for some time, especially during the current bull market. It jumped to 109.7 during the week of February 26. That’s a new cyclical high, and up 13.3% from 96.9 at the end of last year. Driving it higher recently have been the drop in initial unemployment claims and the continued strength in the CRB raw industrials spot price index. (We update this chart regularly for subscribers in Fundamental Stock Market Indicator Alert.)


The Small Business Optimism Index, which is based on 10 of the survey’s indicators, rose to 94.5 in February. That’s the best reading since the end of 2007, and well above the March 2009 low of 81.0. It is still well below readings of around 100 that were the norm during the good times from 1986-2006. However, that means that there is room for improvement, which is likely over the rest of the year. (We update this chart regularly for subscribers in Small Business Survey Alert.)


S&P 500 & Crude Oil

On several occasions over the past year, I’ve observed that three is the charm among the four years of presidential terms. The S&P 500 has been up 18.4%, on average, during the past 14 third years of the presidential cycle without one down year. The market was tracking its historical composite very closely until the past couple of days. The S&P 500 closed at 1310.13 yesterday, 2.4% below the third-year composite index. The third-year composite for the S&P 500 rises to 1489 by the end of the year. Our forecast is 1500, which would be a 14.5% gain from yesterday’s close and a 19.3% increase for the year. Will it be different this time because geopolitics will trump domestic politics? (We update these charts regularly for subscribers in S&P 500 During Third Years of Presidential Terms.)
According to the latest CFTC Commitments of Traders report, Large Speculators were long WTI crude oil futures contracts to purchase a record 271.9 million barrels during the week of March 1. That’s up 89.7% from 5 weeks ago, and the highest ever. If and when the turmoil in the Middle East settles down, there is a potential for a massive long-covering drop in oil prices. When that happens, the third-year pattern for the S&P 500 should resume. (We update these charts regularly for subscribers in Commitments of Traders.)

Monday, March 7, 2011

Labor Market Indicators


The four-week average of initial unemployment claims is tracing out an Old Normal spike as it dropped to 388,500 during the final week of February. That’s the first reading under 400,000 since July 2008, and well below the latest cyclical peak of 643,000 during the week of April 4, 2009.


While initial jobless claims are declining, the average duration of unemployment shot up in February to a record high of 37.1 weeks. As a result, more people are dropping out of the labor force. The unemployment rate has dropped from a peak of 10.1% during October 2009 to 8.9% during February. Over this 16-month period, the labor force declined by 776,000. Had it remained unchanged, the number of unemployed today would be up by as much to 14.4 million, and the unemployment rate would be 9.4%. Had the labor force increased by as much as the working-age population (by 2.3 million) over this period, the unemployment rate would be 10.7%!


Wednesday, March 2, 2011

S&P 500, Oil, & Copper


Until the recent turmoil started in the Middle East, rising oil prices confirmed that the global economy was recovering. So that was good for stocks. Now I’m hearing from our institutional accounts lots of concerns that rising oil prices attributable to supply disruptions in the Middle East could disrupt the global expansion. The S&P 500 and the price of Brent crude oil have been highly correlated over the past two years. In recent days, stock prices have stumbled as the price of oil has soared.


There has also been a strong correlation between the S&P 500 and the price of copper over the past two years. Copper remains near its recent record high, but hasn’t risen recently as the price of oil soared, increasing the risk of weaker global economic growth.

Corn & Oil Prices

Several of Mr. Bernanke’s critics, including yours truly, believe that QE-2.0 has been a major contributor to soaring commodity prices. Soaring food prices certainly contributed to the “unrest” Mr. Bernanke noted in passing in his congressional testimony yesterday. The unrest has resulted in higher fuel prices. While the direct link between QE-2.0 and soaring commodity prices isn’t obvious to the Fed Chairman, it is to me. QE-2.0 unambiguously reinforced the Fed’s long-standing commitment to keep the federal funds rate at nearly zero for an “extended period.” He just doesn’t get it: Easy money always causes bubbles. It is causing one right now in the commodity markets.


All bets are off if the price of Brent crude oil spikes up to $150 a barrel. I first wrote that in the February 17 Morning Briefing. It may be wise to take some bets off even now. I’ve been expecting the oil price to stabilize around $100, but worrying that the chaos in the Middle East might cause a spike to the 2008 record high. I’ve been counting on “stable” OPEC producers to increase their output to offset any shortfalls among “unstable” OPEC producers. That’s reportedly happening right now as the Saudis claim to be set to offset the drop in Libya’s production. Well, Brent soared right through $100 on January 31, and hasn’t looked back as it gapped up in recent days to $115.47 this morning. Oil traders aren’t convinced that the Saudi situation is stable given that dissidents have scheduled a “Day of Rage” in Riyadh on March 11 and another one on March 20.


Tuesday, March 1, 2011

Wages & Salaries in Personal Income

Today, America’s economy seems to be increasingly split between the Haves and Have-Nots. Wages and salaries accounted for a record low of 50.6% of personal income during January. This percentage has been on a downtrend since the data began in January 1959 at 66.2%.

Since 1959, the percentage of personal income attributable to government social benefits has increased from 5.9% to 17.7% currently. (We update these charts monthly for our subscribers in Social Welfare In America.)