Sunday, July 31, 2011

Fixing the Economy


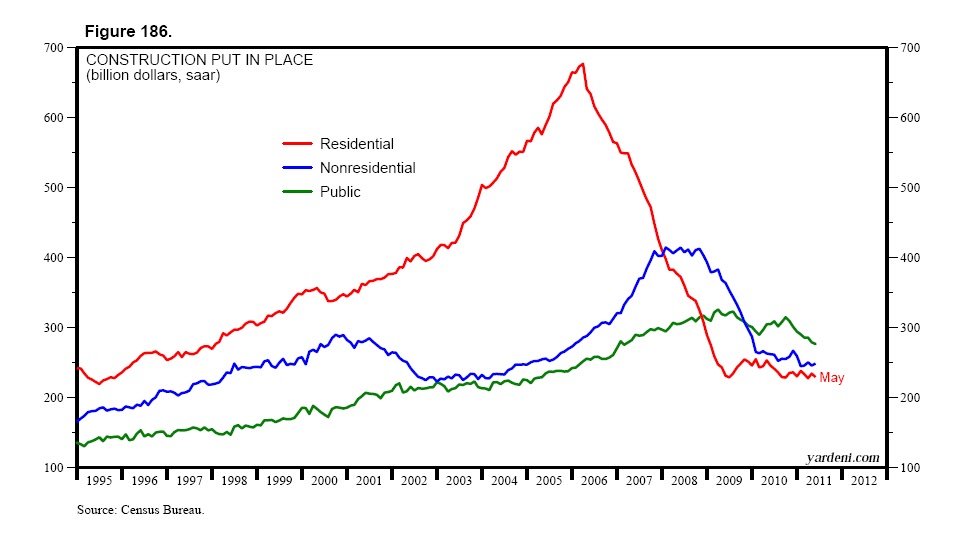
Now that Washington seems to be on the verge of a debt deal, it's time to do something that might actually work to boost economic growth. I will soon meet with my Congressman to pitch one idea for doing so that was inspired by my friend Carl Goldsmith, the chief investment officer of Delta Asset Management. I met with Carl and his colleagues last Wednesday in his office in Los Angeles. Carl rightly observes that one of the main drags on the US economy is the housing industry. In the past, it always rebounded from recessions with V-shaped recoveries, which would boost overall economic growth. This time, the industry remains in a deep recession, which is weighing on the overall economy’s recovery.

Housing starts have been hovering between 475,000 and 690,000 units per month, at seasonally adjusted annualized rates, since the end of 2008. That’s the slowest pace on record, which starts in 1959. Payroll employment in the construction industry has plunged 2.22 million from a record high of 7.73 million during April 2006 to 5.51 million during June.  There must be lots of construction workers among the 6.3 million Americans who have been without a job for more than 27 weeks, i.e., the long-term unemployed.

Carl and I agree that the best way to revive economic growth is to quickly reduce the huge overhang of unsold homes that is depressing both home prices and construction activity. During June, the inventory of single-family existing homes on the market totaled 3.31 million units. There may be another million houses that are in the process of foreclosure or are heading in that direction. Our plan is simple and cost effective:

(1) The federal government should provide a $20,000 matching subsidy toward a down payment on a house to any homebuyer who puts up at least the same amount and is approved for a mortgage loan. The program would be capped at two million existing single-family homes. So the cost of the program would be $40 billion. The purchased property would have to be the primary residence of the buyer.

(2) This program could be paid for by slashing the corporate tax rate on repatriated foreign earnings from 35% to 10%. We estimate that doing so could easily raise the $40 billion necessary to finance the program. Moody’s research recently estimated that at least half of US companies’ record $1,240 billion in cash balances is held overseas. It’s over there and not here because of the large repatriation tax. In recent conversations with top executives of several major US technology companies with cash overseas, Carl was assured that lowering that tax to 10% would bring most of the money to the US.

(3) Rental income would be tax free for 10 years for homebuyers who purchase existing single-family houses as rental properties. They would not be eligible for the down payment subsidy. The 10-year tax-free status of the rental income would be transferable to new owners during that period. The number of rental units under the program would be capped at one million.

The Obama administration has opposed lowering the repatriation tax, arguing that a similar program during 2004, when $300 billion returned to the US, was paid out to shareholders rather than invested in job creation. Our proposal would use the tax revenues from repatriated corporate profits to fund the down payment subsidy program. Combined with the incentive to new landlords, we believe that the overhang of unsold homes could be eliminated within a year. That should set the stage for a significant revival in home building and construction employment.

On May 20, 1862, Congress passed the Homestead Act, which accelerated the settlement of the western territory by granting adult heads of families 160 acres of surveyed public land for a minimal filing fee and five years of continuous residence on that land. Our New Homestead Act should be a win-win for all of us by accelerating the recovery in the housing market. We welcome your thoughts, which will appear in the comments section of the blog.


Thursday, July 28, 2011

Capital Goods Orders & Shipments

The 2.1% drop in June durable goods orders disappointed investors and contributed to yesterdays’ stock market retreat. However, the series is very volatile. Particularly volatile are civilian aircraft orders, which declined 28.9% during June. Also volatile lately have been automobile orders, which are actually the same as the industry’s shipments. They dropped 6.3% over the past three months, mostly because of a shortage of parts made in Japan.

Yet it is heartening to see that over the past three months through June, nondefense capital goods shipments excluding civilian aircraft rose 9.3% (saar) compared to the previous three months, to a new cyclical high. That’s up from March’s 3.9% increase. This augurs well for capital spending. Q2’s real GDP will likely show that capital spending on equipment and software rose faster than Q1’s 8.8% (saar).

 
Admittedly, durable goods orders were disappointing. However, they are volatile, as noted above. Nondefense capital goods orders excluding civilian aircraft rose 16.5% (saar) over the past three months through June compared to the previous three months. That’s not disappointing at all.


Wednesday, July 27, 2011

Jobs & Home Prices

Anyone who might have been expecting a rebound from the soft patch during August and September is likely to be disappointed. That’s because the clowns in Washington are making people cry rather than laugh. The daily barrage of doomsday predictions expressed by top White House and Congressional officials must be depressing both spending by lots of consumers and hiring by lots of companies.

Nevertheless, we expect that initial unemployment claims will soon drop back below 400,000. They did so earlier this year, but have been above that level since the week of April 2. We believe that the ongoing strength in corporate profits should reduce the pace of firing by employers. However, we are concerned that the pace of hiring might remain weak given the uncertainties created by ongoing gridlock in Washington.

One way to gauge the pace of hiring is to monitor the “jobs hard to get” response compiled monthly in the Conference Board’s survey of consumer confidence. It edged up to 44.1% from 43.2% in June. It has been hovering between 42.0% and 50.0% since early 2009. It tends to be a lagging indicator of the labor market during recoveries, especially when compared to initial jobless claims. That makes sense since the pace of firing has to drop before the pace of hiring is likely to increase during recoveries.

Given the lackluster pace of hiring as reflected in the “jobs hard to get” response, it’s not surprising that the Conference Board’s Consumer Confidence Index (CCI) remains relatively depressed this far into an economic recovery. The index did edge up to 59.5 in July, well below its previous cyclical high of 111.9 during July 2007. At 35.7, the CCI Present Situation component is considerably below its March 2007 peak of 138.5.

Also depressing consumer confidence must be the continued weakness in home prices. There was a small m/m uptick in the S&P/Case-Shiller 20 Metros Home Price Index during May. However, the 12-month average of the median existing home price compiled by the National Association of Realtors remained around a cyclical low of $170,000 during the three months through June. Prices haven’t been this low since the spring of 2003, and are down a whopping 24.3% from the record high of $224,283 during July 2006.


Monday, July 25, 2011

Global Oil Demand

World oil demand rose to a record 88.9mbd during June, using the 12-month average to smooth out seasonal volatility. On a y/y basis, it was up 2.5% last month. As a very rough approximation, we double this growth rate to get a rough idea of the growth in world GDP. So, the oil demand data suggest that global economic growth is relatively strong around 5%.

We also disaggregate the data between the Old World (US, Western Europe, and Japan) and the New World (everyone else). The former edged down to 38.1mbd, still well below its record high of 41.9mbd during August 2005. The latter rose to a new record high of 50.8mbd last month.


Old World oil demand is up only 0.9% from a year ago and down 1.1% from two years ago. New World oil demand is up 3.7% and 8.9% over those same two periods.

US Government Outlays & Receipts


I still expect that there will be an agreement in Washington to raise the debt ceiling soon. However, just out of curiosity, let’s review the actual budget numbers over the past 12 months through June and use them to consider what might happen if the government had to balance its budget effective immediately.

Over the past 12 months, federal outlays totaled $3,559.5 billion, well exceeding tax receipts, which totaled $2,298.8 billion. So over the past 12 months, spending would have had to be reduced by 35.4% to balance the budget. (Of course, that ignores that doing so would have depressed economic activity and tax revenues.)

What government spending would be cut to balance the budget if the debt ceiling isn’t increased? The first priority almost certainly would be to make good on interest payments on the federal debt. That number was $220.8 billion over the past 12 months. Social Security obligations should also be met. They totaled $725.2 billion over the past 12 months. So to balance the budget over the past 12 months would have required a 49.2% slashing of outlays excluding those on interest and Social Security.

In Friday’s WSJ, Thomas R. Saving, a former trustee of the Social Security and Medicare Funds, disputed President Barack Obama’s assertion that “there may simply not be the money in the coffers” to send out Social Security checks if the debt ceiling isn’t raised. In fact, the Social Security trust fund has about $2.5 trillion in special nonmarketable bonds issued by the Treasury. Since it isn’t earmarked, the money is gone, having been spent along with other tax revenues on the government’s general expenses.

However, the trustees of the fund could redeem the special bonds to raise the monies needed to send out checks to Social Security recipients. Mr. Saving notes, “By law the Treasury is bound to redeem any bonds presented to it by the Social Security Administration. And when the Treasury does, total government debt subject to the debt limit falls by the amount of the redemption--thus freeing up the Treasury’s ability to issue new bonds equal in amount to the redeemed Trust Fund bonds.”

If we can’t trust in the trust funds set up by the government to fund our retirements, and if we can’t trust our lawmakers to raise the debt limit and reduce the federal deficit to assure financial stability, what should we do? What many of us are doing is putting our trust in gold. This morning, the price of gold is at a new record high of $1,619 per ounce. It may be rapidly converging to $2,516, which is the inflation-adjusted equivalent of the June 1980 record high.

Thursday, July 21, 2011

S&P 500 Revenues & Profit Margin

Globalization isn’t wonderful for everyone. However, it is wonderful for S&P 500 corporations. More and more of them are finding more and more of their revenue and profit growth overseas, as evidenced by the Q2 results of Apple, IBM, and Coca-Cola.

Nominal GDP rose only 3.8% during 2010 compared to 2009 in the US. Yet, S&P 500 revenues rose 8.6% in 2010. Excluding Financials it was up 9.5%. On the other hand, excluding Energy it was up 6.5%, but that still well outpaced the growth in US nominal GDP.

This year, the consensus estimate of revenue growth for the S&P 500 is 9.2%, and 11.2% excluding Financials. During the week of July 15, the estimate for 2011 was $1,034.68 a share, near the highest reading so far this year. The same can be said about the 2012 estimate of $1,097.15.

 
As for 2012, industry analysts are cautiously optimistic, with a projected growth rate of 6.0% for S&P 500 revenues. Given the slowdown in the expected growth of revenues next year, why do industry analysts expect that S&P 500 earnings will rise 15.7% to $113 a share? Their estimates for these two variables imply that they expect that the profit margin of the S&P 500 will rise to 10.2% next year from 9.4% this year.

More likely is that S&P 500 earnings will rise 6.0% in 2011 to $105 a share from $99 this year. That’s because it’s hard to see any upside in the profit margin given that it is back to the previous cyclical high already. There may not be much downside either given the focus on containing costs and boosting productivity. So earnings should grow at the same pace as revenues, which should be around 6%, that should beat the growth rate in US nominal GDP thanks to Globalization.


Wednesday, July 20, 2011

Core Inflation Rates


The trend for core CPI inflation among the 30-member countries of the OECD is still relatively subdued. The OECD rate, excluding food and energy, moved up to 1.7% y/y in May from 1.2% at the start of the year. It was at a record low of 1.1% in September and October of last year. It peaked at 2.4% in the fall of 2008.
 
The CPI inflation in the US is also still relatively subdued. Excluding food and energy, June’s core CPI matched May’s 0.3% gain, which was the largest monthly increase since the summer of 2008. The core rate showed little change all last year, starting 2010 with the first m/m decline since 1982. In June, higher motor vehicle and apparel prices accounted for the larger-than-expected gain. The y/y core rate rose to an 18-month high of 1.6% from a record low of 0.6% last October. The 3-month rate was 2.9% (saar), climbing steadily from October’s 0.4%. That’s the biggest gain since August 2008.


Tuesday, July 19, 2011

The Price of Gold

The price of an ounce of gold rose over $1,600 yesterday. I have frequently observed that gold is a hedge against out-of-control governments. It is a hedge against reckless fiscal and monetary policies. Often in the past, such policies led to higher inflation, which is why gold is widely perceived as a hedge against inflation. However, reckless government economic policies can also lead to financial ruin and deflation.

The price of gold is up at a record high in all the major currencies, suggesting that out-of-control governments are a worldwide plague. The nominal average price in dollars rose to $1,528 during June. In real terms, using the CPI as the price deflator, the price rose to $682, which was still below, but nearing, the record high of $865 during January 1980.


There is an interesting close correlation between the price of gold and the sum of US Treasuries and Agencies held by the Fed and foreign central banks. This shows that the price goes up as banks monetize the swelling debt of the US government. By doing so, reckless monetary policy accommodates reckless fiscal policy! (We regularly update these charts for subscribers to our service in  Currencies & Gold). 

Sunday, July 17, 2011

US Retail Sales


Social insecurity. I have a few relatives who are senior citizens. They depend on their Social Security checks. They are very upset. On Tuesday, July 12, President Barack Obama told CBS News that Social Security checks and veterans’ payments could be threatened if Congress doesn't pass legislation to raise the debt ceiling by the August 2 deadline. “I cannot guarantee that those checks go out on August 3 if we haven't resolved this issue, because there may simply not be the money in the coffers to do it,” he said. “This is not just a matter of Social Security checks,” Obama added. “These are veterans’ checks, these are folks on disability and their checks. There are about 70 million checks that go out.” I guess this proves that there really is nothing in the bogus Social Security Trust Fund.

It’s very irresponsible to scare so many people this way. It could certainly exacerbate the soft patch. Millions of people are all likely to hunker down and spend much less during the rest of July fearing that they won’t get their checks in August. They were already hunkering down during the second quarter according to June’s retail sales report. The three-month average of inflation-adjusted retail sales fell 2.5% (saar) compared to the average during the first quarter, when it was unchanged.


Much of the weakness in retail sales over the past three months was in auto sales as a result of the spike in gasoline prices and the shortage of new cars attributable to supply disruptions following Japan’s earthquake. Excluding autos, inflation-adjusted retail sales rose 0.5% (saar) during Q2 compared to a 0.1% downtick during Q1.

Retail sales should pick up in coming months. The average national gasoline pump price fell to $3.57 a gallon over the past seven weeks after peaking at $3.96 during the week of May 18. Initial unemployment claims fell to 405,000 during the week of July 9. That was the lowest reading since mid-April. That week included the 4th of July holiday, which may have depressed claims. On the other hand, Minnesota had approximately 11,500 of their reported initial claims caused by state employees filing due to the state government shutdown. Jobless claims should drop below 400,000 in coming weeks, confirming that the economy may be coming out of the soft patch.


Thursday, July 14, 2011

S&P 500 Earnings

Financials have been a drag. The consensus expected earnings for this S&P 500 sector for 2011 dropped 2.3% during the week of July 7 to a new low of $15.31 per share. This estimate is down 18.2% from a year ago and 23.3% from two years ago. The sector’s forward P/E peaked at 17.6 during September 2009 and is now down to 11.3. The sector has been underperforming the S&P 500 since April 2010. We’ve rated it an underweight since October 18, 2010 and continue to do so.
The Financials sector is starting to weigh on the overall S&P 500. The composite’s 2011 consensus earnings estimate fell 1.4% over the past two weeks through July 8. This figure actually continues to flatline, as it has been doing since mid-2009.

The recent drop in earnings expectations for the Financials has had a noticeable impact on the second quarter’s consensus earnings expectations for the S&P 500. Before Bank of America announced its big earnings hit on June 29, the S&P 500 earnings consensus was at $24.43 during the week of June 24. It dropped by $1.35, or 5.5%, to $23.08 during the latest week of July 8.


Wednesday, July 13, 2011

China's M2 and Bank Loans

There is a shortage of pigs in China. Meat prices rose 32.3% y/y in China’s June CPI, led by soaring pork prices. This was the major contributor to driving food prices up 14.4%, the highest since June 2008, when rapidly rising pork prices were also a big problem. The overall CPI rose 6.4% y/y, up from 5.5% during May. Excluding food, it was up 3.0%.

The People’s Bank of China (PBOC) has responded to mounting inflationary pressures by raising the official rate three times this year. However, there isn’t much that monetary policy can do to increase the supply of pigs, though it can certainly depress the demand for pork by causing a recession. So far, tighter monetary policy hasn’t done much to depress the growth rates of either bank loans or M2 in China. Nor has it slowed the economy, as widely feared.


China’s M2 jumped 1741 billion yuan in June. On a y/y basis, it is up 15.9% in yuan and 21.9% in dollars. China’s M2 is now 33% greater than America’s M2. In 2000, it was only 30% as large as America’s M2! Financial institutions issued 633.9 billion yuan of new loans in June, up from 551.5 billion yuan in such lending during May. On a y/y basis, loans are up 15.2% in yuan and 21.3% in dollars. A flood of bank lending in recent years has been one factor driving up consumer prices.

China’s second-quarter GDP rose 9.5% y/y, compared with 9.7% growth during Q1. The rate of growth increased on a sequential basis to 9.1% (saar) during Q2 compared with 8.7% during Q1. Industrial production growth in June also came in much faster than expected, rising 15.1% y/y, compared with 13.3% in May.

Tuesday, July 12, 2011

Education and Employment

Employment among adults with college degrees increased 720,000 over the past 12 months to 44.9 million. Over this same period, total household employment increased 242,000. Employment among adults with some college experience has increased by only 58,000 over the past year.

The labor force among adults with only a high school diploma declined by 460,000 over the past 12 months as their employment dropped by 164,000. The labor force is dropping even faster among adult workers with less than a high school degree. It fell 654,000 over the past 12 months. Over the same period, their employment is down 580,000.


The unemployment rate for adult workers with a BA and higher degrees was only 4.4% in June, unchanged from a year ago and well below the national average of 9.2%. At the start of 2009, their unemployment rate was as low as 3.9%. It has been relatively stable just above this low rate since then. The unemployment rate for adults with some college or an associates degree was 8.4% in June. That’s about the same as a year ago, but up from a recent low of 7.4% in March.

The unemployment rate has remained stubbornly high for adults with only a high school education. It was 10.0% in June, only slightly below 10.7% a year ago. Adults without a high school degree are dropping out of the labor force faster than any other group, as their jobless rate remains over 14%.


Sunday, July 10, 2011

US Employment Indicators

According to the Bureau of Labor Statistics (BLS), payroll employment rose only 18,000 during June. May’s gain was also disappointing at 25,000, which was a downward revision from 54,000. Those were both far weaker than April’s increase of 217,000, which was also revised down from 232,000. Were there any disappointing months during the previous economic expansion? Yes there were. In 2004, payroll employment rose only 43,000 in February and 47,000 in July. In 2005, the weakest increase was 63,000 in September. In 2006, there was a small 11,000 gain in May and an 8,000 decline in October.


The index of aggregate hours worked in private industry fell 0.3% overall during June. It was led by a 0.7% drop in manufacturing, which was the first one-month decline since December. Again, a temporary shortage of parts had to be the culprit. Despite June’s decline, the three-month average of the index of aggregate hours worked was still up 3.3% (saar) during Q2 vs. Q1. Normally, that would suggest that real GDP probably rose at least as fast, and probably faster if productivity increased during the quarter. Nevertheless, we are sticking with our conservative projections of 2% for both Q2 and Q3, with a jump of 4% or more during Q4.


Thursday, July 7, 2011

Soft Patch & Stock Prices

There was a soft patch during the previous global economic expansion. The Global Super Composite PMI--which we calculate by averaging the manufacturing and non-manufacturing PMIs for the US, UK, and EU--rose from a March 2003 recession low of 47.9 to a cyclical peak of 57.9 during January 2004. It then dropped back down to a 2005 low of 51.7 during May of that year before recovering to another cyclical peak of 57.1 during April 2006. It then hovered around 55 through August 2007 before starting a huge dive down to a record low of 37.6 during December 2008. What did stock prices do during the previous expansion’s soft patch? The S&P 500 rose during 2004 and early 2005, building on the bull market that had started in early 2003.

So far during the current expansion, there was a brief soft patch last year in the Global Super Composite PMI, which declined from a peak of 56.7 during April to a low of 53.9 during September. The S&P 500 dropped 16.0% from April 23 through July 2. Concerns about a possible double dip were exacerbated by the sovereign debt crisis in the eurozone.

But then the Super PMI rebounded to a new cyclical peak of 58.5 during February 2011. It then dropped to 53.2 during June. Meanwhile, stock prices have held up remarkably well following the rally from July 2 through April 23. We expect that the Super PMI will rebound during the second half of this year much the same as it did last year. If so, then stock prices should end the year higher than today.


Auto sales are down sharply in recent months. There are two obvious explanations. The first is that the spike in the national average price of a gallon of gasoline to a peak of $3.96 depressed sales. The other is that a shortage of parts from Japan following the March 11 earthquake disrupted production and reduced the supply of models available for sale by auto dealers. Of course, it is likely that both explanations caused the drop in sales.

The parts shortage should be over soon. The pump price is still high, but it was down to $3.56 during the week of June 29. At least, no one is talking about it rising to $5 a gallon. We expect a big rebound in auto sales during the last four months of the year.

Total retail motor vehicle sales peaked during February at 13.4 million units (saar). They fell 14.9% to 11.4 million units during June. Over this same period, domestic light truck sales declined by 0.5 million to 5.0 million; domestic car sales dropped by 0.8 million to 3.9 million; and imported models fell by 0.7 million to 2.5 million.

The decrease in imports was probably largely attributable to the plunge in exports of cars from Japan following the earthquake and tsunami. The decline in domestic car sales might have reflected both a shortage of parts and less interest in buying a car when gasoline prices were rising rapidly. Interestingly, sales of light trucks, which tend to be less fuel efficient, dropped the least, suggesting that parts shortages played a bigger role than higher gasoline prices in depressing sales in recent months.


The rebound in the Super PMI should be led by a rebound in the global auto industry, including the one in the US. One US industry that is likely to remain stuck in the mud is construction. Indeed, the value of total construction put in place fell to a new recession low for the industry during May. It was $753.5 billion (saar), down 37.9% from the record high during March 2006 and the lowest since September1999. Here are a few more details on the sorry state of this industry:

(1) The weakest sector in the industry remains residential construction. It peaked at a record $676.4 billion during March 2006. After crashing through 2008, it has been in a coma, flat-lining slightly south of $250 billion since late 2009.

(2) Nonresidential construction has also been flat-lining slightly north of $250 billion since early 2010. Its hay days were during 2008, when spending was hovering around $400 billion.

(3) Another clunker has been construction spending by the public sector. Despite all the money spent to stimulate the economy by Washington from 2009-2011, little of it stimulated public construction. Indeed, in May it was $276.3 billion, the lowest since February 2007 and actually down from a record high of $325.5 billion during March 2009.

Wednesday, July 6, 2011

Purchasing Managers Indexes

There are some hard spots in the soft patch. That’s why stock prices rallied so nicely last week. The DJIA jumped 153 points on Thursday after June’s Chicago purchasing managers index (PMI) came in at 61.1, up from 56.6 in May. The national manufacturing PMI was released Friday morning, helping to boost the DJIA by another 168 points by the end of the day. It rose from 53.5 in May to 55.3 in June. However, the components of the index suggest that supply disruptions were still weighing on manufacturers, as the production index edged up by only 0.5pps to 54.5. The inventories index contributed the most to the overall PMI, rising 5.4pps to 54.1, suggesting that the parts shortage may end soon.

The eurozone’s M-PMI fell to 52.0 in June from 54.6 in May. Germany’s PMI dropped to 54.6, only the second reading below 60.0 since November. The French index slipped to 52.5 last month from 55.0 in May. The UK’s PMI dropped to a 21-month low of 51.3 last month. Compounding the gloom, manufacturing in Italy, Ireland, Spain, and Greece all contracted in June, as their PMIs were below 50. China’s M-PMI was weak again in June, falling to 50.9, the lowest reading since February 2009. However, the production index was still at 53.1. The overall index should rebound in July and August as the Japanese parts shortage problem comes to an end.