Sunday, December 29, 2019

Central Banks Likely to Keep Santa Claus Rally Going In 2020

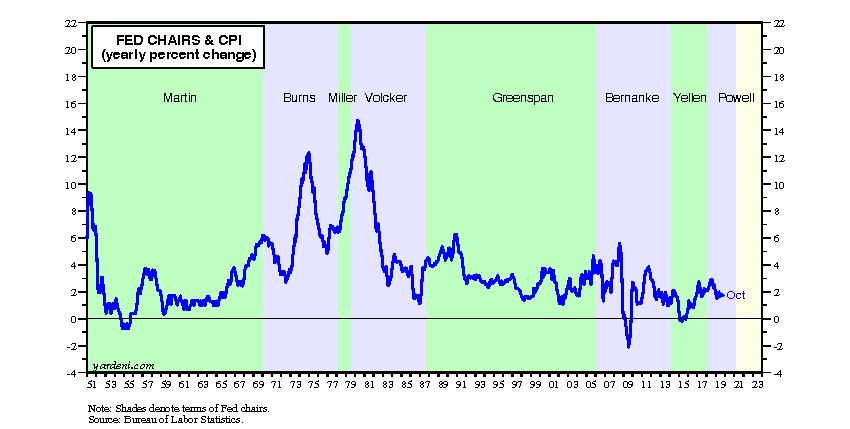
Former Fed Chair Paul Volcker passed away on 12/8. He broke the back of inflation. Unfortunately, he had to cause a recession to do so, which broke the backs of lots of good hard-working people. He was widely viewed by them as the Grinch Who Stole Christmas. All of the Fed chairs who came after have preferred playing the role of Santa Claus, showering us all with lots of easy money. They were able to do so mostly because inflation has remained subdued ever since Volcker subdued it.

Actually, at the end of last year, Fed Chair Jerome Powell seemed more like a Grinch than a Santa. He roiled the financial markets by suggesting that the Fed would continue to raise the federal funds rate three or four times during 2019. He started to change his mind just around Christmas of last year and signaled that the Fed would halt rate hikes for a while. He completed his pivot by lowering the federal funds rate three times this year, on 7/31, 9/18, and 10/30 (Fig. 1).

As a result, the S&P 500 stock price index bottomed on Christmas Eve last year at 2351.10 (Fig. 2). It was up 37.8% to 3240.02 on Friday, 12/27 (Fig. 3). That’s a very long Santa Claus rally.

At the 7/31 meeting of the FOMC, the committee decided not only to lower the federal funds rate, for the first rate cut since 2008, but also to terminate quantitative tightening (QT) ahead of schedule: “The Committee will conclude the reduction of its aggregate securities holdings in the System Open Market Account in August, two months earlier than previously indicated.” From 10/1/17 through 7/31/19, the Fed’s balance sheet was pared from $4.4 trillion to $3.7 trillion (Fig. 4).

The Fed and the other major central banks are all playing Santa during this holiday season and are on track to continue doing so in the new year:

(1) Fed. In a 10/11 press release, the Fed announced that beginning on 10/15 it “will purchase Treasury bills at least into the second quarter of next year in order to maintain over time ample reserve balances at or above the level that prevailed in early September 2019.” More details were released in a separate New York Fed statement (and accompanying FAQs).

The initial pace of these “reserve management” (RM) purchases will be approximately $60 billion per month and will be in addition to ongoing purchases of Treasuries related to the reinvestment of principal payments from the Fed’s maturing holdings of agency debt and agency mortgage-backed securities. As the new holdings mature, the principal payments will be reinvested again into T-bills.

Many have commented that these actions look a lot like quantitative easing (QE). After all, the Fed is expanding its balance sheet sizably, possibly by up to $300 billion or more assuming $60 billion a month through March as a ballpark figure. The Fed’s balance sheet totaled $4.0 trillion during the 12/4 week, including $2.3 trillion in US Treasury securities, of which $420 billion are Treasuries maturing in one year or less (Fig. 5). This portfolio of Treasuries maturing in under a year is up $71 billion since the end of September.

(2) ECB. Mario Draghi’s term as president of the European Central Bank (ECB) ended on 10/31. Before leaving, Draghi put together a monetary stimulus package. It is designed to induce Eurozone governments to borrow at zero or negative interest rates to spend on stimulating their economies.

The package includes an open-ended commitment to buy as much as €240 billion per year of bonds issued by Eurozone governments. In other words, Draghi set the stage for the implementation of Modern Monetary Theory (MMT) in the Eurozone. According to MMT, governments should borrow as much as possible as long as inflation doesn’t heat up. All the better if the central bank enables such borrowing by lowering interest rates and purchasing government bonds—again, as long as inflation doesn’t heat up. Now it is up to the various Eurozone governments to take the bait.

The ECB terminated its QE1 program at the end of 2018. Under the program, which started 1/22/15, the ECB’s “securities held for monetary policy purposes” increased by €2.4 trillion to €2.7 trillion (Fig. 6). Draghi’s QE2 program will once again expand the ECB’s balance sheet to new record highs.

(3) BOJ. In an 11/18 Reuters interview, Bank of Japan (BOJ) Governor Haruhiko Kuroda said the BOJ has room to deepen negative interest rates, but he signaled there were limits to how far it can cut rates or ramp up stimulus.

According to Reuters, “Kuroda also said there was still enough Japanese government bonds (JGB) left in the market for the BOJ to buy, playing down concerns its huge purchases have drained market liquidity. After years of heavy purchases to flood markets with cash, the BOJ now owns nearly half of the JGB market.”

The BOJ’s QE program started in April 2013 and has yet to be terminated. This can be seen in bank reserve balances at the BOJ. They rose to a record high of ¥352 trillion during November, up 740% since the start of the program (Fig. 7).

(4) All together now. The total assets of the Fed, ECB, and BOJ rose $264 billion y/y during November to $14.5 trillion (Fig. 8). On this basis, they had been falling from December 2018 through September 2019. This total is on track now to rise to record highs in 2020.

That should be good for the stock market, which has been tracking the total assets of the three major central banks since the start of the current bull market (Fig. 9). Don’t fight the three major central banks.

The main near-term risk is a meltup that could set the stage for a correction. My S&P 500 forecast for year-end 2020 is still 3500. I just hope we don't get there well ahead of schedule. See CNBC: "A 10% to 20% pullback could strike stocks early next year, long-time bull Ed Yardeni warns."

Tuesday, December 10, 2019

Paul Volcker: The Great Disinflator

The following is an excerpt about Paul Volcker, who passed away on December 8, from my forthcoming book, Fed Watching for Fun and Profit.

When Volcker took the helm of the Fed, the Great Inflation was well underway. During the summer of 1979, oil prices were soaring again because of the second oil crisis, which started at the beginning of the year when the Shah of Iran was overthrown. Seven months later, in March 1980, the CPI inflation rate peaked at its record high of 14.8%. When Volcker left the Fed during August 1987, he had gotten it back down to 4.3%.

How did he do that?

Volcker didn’t waste any time attacking inflation. Eight days after starting his new job, he had the FOMC raise the federal funds rate on August 14, 1979, by 50 basis points to 11.00%. Two days later, on August 16, he called a meeting of the seven members of the Federal Reserve Board to increase the discount rate by half a percentage point to 10.50%. This confirmed that the federal funds rate had been raised by the same amount. Back then, as I previously noted, FOMC decisions weren’t announced. The markets had to guess.

On September 18, 1979, Volcker pushed for another discount-rate hike of 50 basis points to 11.00%. However, this time, the vote wasn’t unanimous; the Board was split four to three. In his memoir, Volcker wrote that market participants concluded that “the Fed was losing its nerve and would fail to maintain a disciplined stance against inflation.” The dollar fell and the price of gold hit a new record high.

Volcker, recognizing that the Fed’s credibility along with his own were on the line, came up with a simple, though radical, solution that would take the economy’s intractable inflation problem right out of the hands of the indecisive FOMC and the Board: The Fed’s monetary policy committee would establish growth targets for the money supply and no longer target the federal funds rate.

This new procedure would leave it up to the market to determine the federal funds rate; the FOMC no longer would vote to determine it! This so-called “monetarist” approach to managing monetary policy had a longtime champion in Milton Friedman, who advocated that the Fed should target a fixed growth rate in the money supply and stick to it. Under the circumstances, Volcker was intent on slowing it down, knowing this would push interest rates up sharply.

On October 4, Volcker discussed his plan with the Board. In his memoir, he noted, “Even the ‘doves’ who had opposed our last discount-rate increase were broadly supportive, having been taken aback by the market’s violent reaction to the split vote.” A special meeting of the FOMC was scheduled for Saturday, October 6. Holding an unprecedented Saturday night press conference after the special meeting, Volcker unleashed his own version of the Saturday Night Massacre. He announced that the FOMC had adopted monetarist operating procedures effective immediately. He said, “Business data has been good and better than expected. Inflation data has been bad and perhaps worse than expected.” He also stated that the discount rate, which remained under the Fed’s control, was being increased a full percentage point to a record 12.00%. In addition, banks were required to set aside more of their deposits as reserves.

The Carter administration immediately endorsed Volcker’s October 6 package. Press secretary Jody Powell said that the Fed’s moves should “help reduce inflationary expectations, contribute to a stronger US dollar abroad, and curb unhealthy speculation in commodity markets.” He added, “The Administration believes that success in reducing inflationary pressures will lead in due course both to lower rates of price increases and to lower interest rates.”

The notion that the Fed would no longer target the federal funds rate but instead target growth rates for the major money supply measures came as a shock to the financial community. It meant that interest rates could swing widely and wildly. And they did. The economy fell into a deep recession at the start of 1980, as the prime rate soared to an all-time record high of 21.50% during December 1980. The federal funds rate rose to an all-time record high of 20.00% at the start of 1981. During 1980, the discount rate was raised to 13.00% on February 15, then lowered three times to 10.00%, then raised again two times back to 13.00%, on the way to the all-time record high of 14.00% during May 1981. The trade-weighted dollar index increased dramatically by 56% from 95 on August 6, 1979, when Volcker became Fed chair, to a record high of 148 on February 25, 1985.

The public reaction to Volcker’s policy move was mostly hostile. Farmers surrounded the Fed’s headquarters building in Washington with tractors. Homebuilders sent Volcker sawed-off two-by-fours with angry messages. Community groups staged protests around the Fed’s building. Volcker was assigned a bodyguard at the end of 1980. One year later, an armed man entered the building, apparently intent on taking the Board hostage.

At my first job on Wall Street as the chief economist at EF Hutton, I was an early believer in “disinflation.” I first used that word, which means falling inflation, in my June 1981 commentary, “Well on the Road to Disinflation.” The CPI inflation rate was 9.6% that month. I predicted that Volcker would succeed in breaking the inflationary uptrend of the 1960s and 1970s. I certainly wasn’t a monetarist, given my Keynesian training at Yale. I knew that my former boss [at the Federal Reserve Bank of New York] wasn’t a monetarist either. But I expected that Volcker would use this radical approach to push interest rates up as high as necessary to break the back of inflation.

Volcker must have known that would cause a severe recession. I did too. Back then, I called Volcker’s approach “macho monetarism.” I figured that a severe recession would bring inflation down, which in turn would force the Fed to reverse its monetary course by easing. That would trigger a big drop in bond yields. Arguably, the great bull market in stocks started August 12, 1982, when the Dow Jones Industrial Average dropped to 776.92. On December 6, 2019, it was 27,677.79.

Thank you, Paul Volcker.

Thursday, December 5, 2019

Inflation Remains in a Coma in Major Economies, Frustrating Central Bankers

I’ve been a disinflationist since the early 1980s. I first used that word, which means falling inflation, in my June 1981 commentary, “Well on the Road to Disinflation.” The Consumer Price Index (CPI) inflation rate was 9.6% y/y that month (Fig. 1). I predicted that Fed Chair Paul Volcker would succeed in breaking the inflationary uptrend of the 1960s and 1970s when he adopted a monetarist approach during October 1979. I certainly wasn’t a monetarist, given my Keynesian training at Yale. I knew that my former boss at the Federal Reserve Bank of New York wasn’t a monetarist either. But I expected that Volcker would use this radical approach to push interest rates up as high as necessary to break the back of inflation. Which is what he did.

Ever since then, reflationists have been predicting, without any success, that inflation is bound to make a comeback. They’ve been wrong for so long because inflation is so yesterday. The Great Inflation was basically a 1970s phenomenon attributable to the two oil price shocks of 1973 and 1979 (Fig. 2). Thanks to cost-of-living clauses in private-sector union contracts back then, those price shocks were passed directly to wages, causing a wage-price spiral (Fig. 3).

The CPI isn’t the best measure of price inflation because it has a significant upward bias. The Fed prefers the core personal consumption expenditures deflator (PCED), which better reflects the prices of the goods and services that consumers are actually buying. According to this measure, inflation has ranged between a low of 0.9% and a high of 2.6% since 1995 (Fig. 4).

In recent years, I’ve often declared: “Inflation is dead.” I’ve frequently discussed the four deflationary forces (which I call the “4Ds”) that have killed it. They are détente, disruption, demography, and debt. (See my 8/1 LinkedIn article, "The Great Inflation Delusion.")

The data show that at best inflation is in a coma, especially in the major industrial economies. Here is an update on the latest inflation readings:

(1) US CPI and PCED. In the US, the headline and core CPI were up 1.8% and 2.3% y/y, respectively, in October. However, the comparable readings for the PCED were only 1.3% and 1.6% (Fig. 5).

Now sit down for this one: The Fed is seriously considering a “make-up” strategy for targeting inflation. That’s according to yesterday’s FT article “US Federal Reserve considers letting inflation run above target.” Here is the gist of the plan: “The Fed’s year-long review of its monetary policy tools is due to conclude next year and, according to interviews with current and former policymakers, the central bank is considering a promise that when it misses its inflation target, it will then temporarily raise that target, to make up for lost inflation.”

With all due respect, that’s hilarious! Why do Fed officials want to embarrass themselves by targeting inflation over 2.0% when they haven’t been able to move it up to 2.0% since officially targeting that level in January 2012? Fed Governor Lael Brainard, speaking to reporters last week, said that a strict make-up rule would be too hard to explain to the public. I think she is right.

Since January 2012, the headline PCED has been tracking a 1.3% annual trendline (Fig. 6). In other words, October’s PCED was 4.7% below where it should have been if it had been tracking 2.0%. To get back to the steeper trendline by the end of 2022, the PCED would have to increase by about 12.0%, or 4.0% per year! Try explaining that to the public.

By the way, the big divergence between the CPI and PCED inflation rates during October was mostly attributable to consumer durables (up 0.5% in the CPI and down 1.0% in the PCED) (Fig. 7). In addition, medical care services was up much more in the CPI (5.1%) than in the PCED (2.1%) (Fig. 8). These divergences aren’t unusual but par for the course. Rent inflation tends to be almost identical in the CPI and the PCED, but it has a much higher weight in the former than the latter, and it has been running hotter (at 3.7%) than the overall inflation rate (Fig. 9).

(2) Eurozone CPI. An 11/28 Bloomberg article reported that the European Central Bank (ECB) is expected to “tweak” its inflation target in an upcoming review of monetary policymaking: “The institution’s first fundamental assessment in 16 years might conclude with a goal of 2%—instead of the current ‘below, but close to, 2%’ which some governors worry risks leaving inflation too weak.” One word comes to mind: “Lame.”

During November, the Eurozone’s CPI inflation rate picked up to 1.0% from a three-year low of 0.7% in October (Fig. 10). The core rate was 1.3%, the highest in seven months.

On 11/22/19, Christine Lagarde delivered her first speech as ECB president, “The future of the euro area economy.” Remarkably, she spoke about monetary policy almost in passing, in just one paragraph in fact. Instead, she presented a case for fiscal policy to focus on more public investments in infrastructure, R&D, and education. She also said she wants to see more economic integration in the EMU. She is one of the few central bankers who seems inclined to acknowledge that monetary policy may have lost its effectiveness.

(3) Japan CPI. An 11/18 Bloomberg article reported that the Bank of Japan (BOJ) may be running out of ammo to boost inflation in Japan: “Speaking in parliament on Tuesday, [Bank of Japan Governor Haruhiko] Kuroda said there was still room to lower interest rates further, but added that he had never claimed the BOJ’s easing ammunition was endless or that there was no limit on how low rates could go.”

In fact, he is running out of support for additional monetary stimulus measures.The article observed: “Such low yields have gradually pushed institutional investors and regional banks out of the JGB market and into riskier assets. Many analysts see bankruptcies looming among beleaguered regional banks, where the old model of borrowing short and lending long has been upended both by a flat yield curve and a diminished demand for credit.”

The BOJ has been reluctant to follow its peers around the world in easing policy this year, suggesting that the days of shock and awe from Kuroda’s BOJ are over. There is more talk about doing more to stimulate the economy with fiscal policy, but it’s all talk so far.

Meanwhile, Japan’s CPI inflation rate is on life support. The headline rate was up just 0.2% during October (Fig. 11). The core rate, which includes oil costs but excludes volatile fresh food prices, rose 0.4% y/y in October. Excluding the impact of the sales tax hike rolled out in October and the introduction of free childcare, annual core consumer inflation was 0.2% in October, slowing from 0.3% in September.

(4) China CPI. China’s headline CPI inflation rate jumped to 3.8% during October (Fig. 12). That was the highest since January 2012. However, it was boosted by soaring pork prices, which lifted overall food-price inflation to a more-than-11-year high, as consumer demand drove up prices for pork alternatives including eggs and other meat products. Hog prices have soared this year at the fastest pace on record as a result of the deadly African swine flu. Excluding food, the CPI was up just 0.9% during October!

(5) Bottom line. Inflation is in a coma. The major central banks continue to provide ultra-easy monetary policy to revive it. All their efforts have been frustrated by the four powerful forces of deflation. Their ultra-easy monetary policies continue to drive stock prices higher, while keeping interest rates at record lows.

(6) Contrarian alert. Contrarians on inflation can take some comfort from the front cover of the April 22, 2019 Bloomberg Businessweek shown above.

Wednesday, November 27, 2019

Thanksgiving: The Bull Is No Turkey

Thanksgiving is my favorite holiday. It’s great getting together with family and friends. We always take turns—going around the dinner table—sharing what we are most thankful for. The comments tend to focus on health and supportive family members.

According to the weather forecasters, most of us won’t be thankful for the weather on Thursday when we gather for Thanksgiving. It’s going to be stormy around the country. Depending on the winds, the organizers of the Macy’s Thanksgiving Day Parade might have to ground their balloons.

For those of us in the stock market, the questions are whether there will be a Santa Claus rally this year, and whether it will inflate stock prices with too much hot air. I am predicting that the S&P 500 will reach 3500 by the end of next year. That’s an increase of 12.5% over Friday’s close, which itself represents a year-to-date gain of 24.1%.

My main worry currently is that the S&P 500 will get to 3500 well ahead of schedule in a meltup scenario. My 3100 target for this year was surpassed on 11/15. However, that was actually well behind schedule, since 3100 had been my target for the end of last year. Everything was working out fine for my forecast through 9/20/18, when the S&P 500 peaked at 2930.75. But then recession fears emerged as investors fretted that the Fed was set on an overly restrictive monetary policy course and that the trade war with China was escalating. The S&P 500 proceeded to plunge by 19.8% through the day before Christmas (Fig. 1).

The day after Christmas, investors came to their senses, betting that Fed officials would do the same and that the US and China would eventually work out a trade deal. As a result, there has been a meltup of sorts in the S&P 500 and its 11 sectors since the day before last Christmas through Friday’s close, as follows: Information Technology (50.0%), Industrials (35.3), Communication Services (35.2), Financials (33.7), S&P 500 (32.3), Consumer Discretionary (30.5), Real Estate (26.9), Consumer Staples (25.4), Materials (25.4), Utilities (21.7), Health Care (21.6), and Energy (10.0) (Fig. 2).

However, it doesn’t look like a meltup when we compare the market’s performance since last year’s 9/20 peak: Utilities (18.8%), Information Technology (15.3), Real Estate (14.4), Communication Services (12.5), Consumer Staples (11.0), S&P 500 (6.1), Health Care (4.2), Financials (3.4), Industrials (2.7), Consumer Discretionary (1.0), Materials (-2.4), and Energy (-20.7) (Fig. 3).

When we look at fluctuations in the S&P 500’s valuation multiple, however, the picture does look like a meltdown during 2018 followed by a meltup this year (Fig. 4). The forward P/E of the S&P 500 peaked at 18.6 on 1/23/18, the highest reading during the current bull market. It crashed 28% to 13.5 on 12/24/18. It soared back up to 17.5 last week.

Let’s consider some of the possible events during the holiday season that might fuel the meltup or trigger panic attack #66. (See our table of the 65 panic attacks since the start of the current bull market.) Let’s start with the meltup scenario:

(1) Growth. On the meltup side, investors are starting to anticipate better global economic growth next year, while inflation is expected to remain subdued. This year’s earnings growth slowdown to near zero was mostly attributable to tough y/y comparisons because last year’s growth rate was boosted by Trump’s tax cut and higher Energy earnings. Earnings comps should be easier next year, with industry analysts currently projecting gains for S&P 500 operating earnings of 9.1% in 2020 and 10.8% in 2021 (Fig. 5). I think the analysts are too optimistic, as they often have been in the past. Earnings should grow in line with revenues growth, which is currently expected to be 5.2% in 2020 and 4.7% in 2021 (Fig. 6). Analysts tend to be more realistic about revenues growth than earnings growth.

(2) Monetary policy. The major central banks are likely to persist with their ultra-easy monetary policies. The Fed probably will keep the federal funds rate unchanged through next year’s election. However, the Fed started buying $60 billion per month in Treasury bills during mid-October and will continue doing so through mid-2020 (Fig. 7). On the other hand, the Fed’s holdings of mortgage-backed securities continue to decline (Fig. 8).

Now let’s consider some of the possible triggers of yet another panic attack and why the next one should be followed by yet another relief rally rather than a bear market:

(3) Trade war. Both China and the US have a clear interest in getting a phase-one trade deal completed relatively soon to calm financial markets and reduce the drag on their economies from the uncertainty attributable to the trade war. However, it won’t be a done deal until the deal is done.

Trump wants to secure a big phase-one announcement. He is expecting that the Chinese will commit to purchases of US agricultural goods that he can tout as an important win during his re-election campaign. The signing of a phase-one deal could slide into next year as the two countries tussle over Beijing’s demand for more extensive tariff rollbacks.

In any event, Beijing trade officials aren’t likely to sit down to discuss a phase-two deal before the US election, in part because they want to wait to see if Trump wins a second term.

If there is no deal, stock prices could crater. However, Trump views the DJIA as his most important poll. So he would likely respond to a market selloff with some encouraging words. More importantly, Fed officials would most likely signal a willingness to ease some more if trade headwinds threaten to depress the US economy.

(4) Hong Kong. An 11/25 NBC News article reported: “Pro-democracy forces swept Hong Kong district council elections over the weekend, boosting pressure on the city’s Beijing-backed government to listen to protesters’ demands for greater freedoms.

“China responded sternly to the landslide in the vote widely seen as a referendum on public support for the anti-government movement. Foreign Minister Wang Yi said that no matter how the situation in Hong Kong changes, the semiautonomous region is part of China.”

Beijing has avoided directly intervening so far, preferring to let Hong Kong’s embattled leader Carrie Lam handle the situation. In this age of smartphones, Beijing has been deterred from cracking heads and having the carnage live-streamed around the world.

(5) Middle East. Yesterday, Brig.-Gen. Zvika Haimovich, former commander of the Israel Defense Forces’ Aerial Defense Division, warned that Iran is planning a “multi-directional” attack against the state of Israel together with its proxies, and that the Jewish state needed to prepare for it now.

Iran has been gripped by an economic crisis since the US restored painful sanctions on 5/8/18 after withdrawing from the 2015 nuclear deal. Last week, there were widespread riots in Iran following a fuel price hike by the government. During the violence, dozens of banks, gas pumps, and police stations were torched across the Islamic republic.

Iranian officials accused the US, Britain, Israel, and Saudi Arabia of stoking the unrest. Yesterday, the head of Iran’s Islamic Revolutionary Guard Force threatened to destroy Israel, the US, and other countries as he addressed a pro-government demonstration.

There's plenty to worry about. But let's enjoy Thanksgiving and look forward to a Santa Claus rally, maybe.

Tuesday, November 19, 2019

Are Stocks Overvalued?

In my book Predicting the Markets (2018), I reviewed various valuation models that stock investors follow. My main takeaway was that, “Judging valuation in the stock market is akin to judging a beauty contest. … Not only is beauty subjective, Hollywood tells us—it can be dangerous. At the end of the original version of the movie King Kong (1933), the big ape’s death is blamed by his handler on Ann Darrow, Kong’s blonde love interest, played by Fay Wray: ‘It was beauty that killed the beast.’ Valuation is in the eye of the beholder too. And buying stocks when they are most loved and very highly valued can also be deadly.”

In today’s politically correct times, it’s probably best to compare valuation to a talent contest rather than a beauty contest. Like any objective judge at a talent show, I want to see the contestants compete before I pick the winner. In recent years, I’ve given more of my votes to the contestants that incorporate inflation and interest rates into their acts. That’s led me to a more sanguine opinion about stock valuation than suggested by the more traditional reversion-to-the-mean P/E models, especially the ones based on trailing earnings.

Here’s an update of four of the valuation models that I reviewed in my book:

(1) Buffett ratio. Warren Buffett has said he favors the ratio of the value of all stocks traded in the US to nominal GNP, which is nominal GDP plus net income receipts from the rest of the world (Fig. 1). The data for the numerator are included in the Fed’s quarterly Financial Accounts of the United States and lag the GNP report, which is available on a preliminary basis a few weeks after the end of a quarter. Needless to say, they aren’t exactly timely data. However, the forward price-to-sales ratio of the S&P 500, which is available weekly, has been tracking Buffett’s ratio very closely. The quarterly series is back at the 1.90 peak just before the bear market of 2000-2002. The weekly series was 2.07 at the end of October. Buffett has remained bullish, observing that historically low inflation and interest rates justify these high ratios.

(2) Rule of 20. The “Rule of 20” was devised by Jim Moltz, my mentor at CJ Lawrence. It simply compares the S&P 500 forward P/E to the difference between 20 and the inflation rate, using the y/y percent change in the CPI. When the sum of the forward P/E and the inflation rate is above (below) 20, stocks are deemed to be overvalued (undervalued) (Fig. 2). It was slightly below 20.0 during October. This rule of thumb has had a few hits and misses, as have more sophisticated models.

(3) Real earnings yield. The earnings yield of the S&P 500, which is simply the reciprocal of the P/E based on reported earnings, is highly correlated with the CPI inflation rate on a y/y basis. The real earnings yield (REY) of the S&P 500 is the difference between the nominal yield and the inflation rate (Fig. 3). The result is a mean-reversion valuation model that logically includes inflation.

The average of the real yield since 1952 through Q3-2019 is 3.19%. The model tends to anticipate bear markets when the yield falls close to zero. Our friend John Apruzzese, the Chief Investment Officer of Evercore Wealth Management, examined this model in a November 2017 paper titled “A Reality Check for Stock Valuations.” Based on the REY model, he found that “stocks appear more reasonably priced than the conventional P/E ratio suggests during periods of low inflation and rising markets, and more expensive during periods of high inflation and falling markets when they otherwise might seem cheap.”

According to the model, stocks remained reasonably priced during Q3, with the REY at 2.92%.

(4) Misery-adjusted P/E (MAPE). The Misery Index is the sum of the unemployment rate and the yearly percent change in the CPI inflation rate (Fig. 4 and Fig. 5). The Misery Index tends to fall during bull markets and to bottom before bear markets. It was down to 5.4% during October, almost matching the most recent low of 5.0% during September 2015, which was the lowest reading since April 1956. What you’re about to hear may be hard to believe, I know, amid all the naysaying by all the naysayers, but the truth is: Most Americans have never been less miserable, at least in terms of how they’re affected by the performance of the macro-economy.

I’ve found that there is a reasonably good inverse correlation between the forward P/E of the S&P 500 and the Misery Index (Fig. 6). That makes sense to me. When we are miserable, we aren’t in the mood to drive up the valuation multiple. When we are happy, we tend to become exuberant, driving up the P/E. However, a high P/E, by historical standards, may not necessarily reflect irrational exuberance if interest rates are historically low because inflation is subdued. In other words, the current readings of the Misery Index are historically low and may justify P/Es that exceed the historical average.

My homebrewed MAPE is the sum of the S&P 500 forward P/E and the Misery Index (Fig. 7). It averaged 23.8 from September 1978 through October 2019. Readings above (below) the average suggest stocks are overvalued (undervalued). It was 22.6 during October, i.e., below average. MAPE correctly warned that stocks were overvalued prior to the bear markets of the early 1980s and 2000s. It did not anticipate the last bear market, but that’s because the problem back then was the overvaluation of real estate, not stocks.

Thursday, November 14, 2019

Zombies in the Fed's Soup

I’m finishing up writing my next book, Fed Watching for Fun and Profit: A Primer for Investors. I’ve had a lot of fun writing it, and it has given me a broader perspective on the making of monetary policy by the Fed in particular and central bankers in general.

In my opinion, they all suffer from group-think.

They all use the same or similar models of the economy. Some are empirical models, but most are theoretical. The empirical ones create the illusion of a precise scientific analysis of how the economy works. The theoretical ones tend to be, well, too theoretical. Both can be quite misleading, especially if they are based on faulty assumptions and logic. Put simply, most of the models reflect thinking that bears little resemblance to reality and lacks plain old common sense.

When reality conflicts with what their models suggest to be the case, the central bankers—rather than questioning their models and learning from their mistakes—resolve the cognitive dissonance by doubling down on their commitment to their models. In other words, they do more of the same, expecting that the result will eventually coincide with their models’ predictions.

A case in point is their determination to provide ultra-easy monetary policies to boost inflation to their target of 2.0%. The major central bankers have been trying to do so for over 10 years without success. They seem totally befuddled. Fed officials have recently been talking about their “symmetrical target” of 2.0%, implying that they are willing to let the economy run hot, with inflation exceeding 2.0% for a while, since it has been running below that pace for so long. That’s an interesting idea, but they can’t even get inflation up to 2.0%—why embarrass themselves further by shooting for an even higher target?

The Fed pivoted at the start of this year from signalling three hikes in the federal funds rate during 2019 to actually lowering it three times this year. Outgoing European Central Bank (ECB) President Mario Draghi loaded up his bank’s bazookas yet again as he was walking out the door at the end of October. On 9/12, the ECB’s Governing Council voted to lower the bank’s deposit facility rate from -0.40% to -0.50% and to restart the asset purchase program at the pace of €20 billion per month with no set end date. The Bank of Japan never let up on its ultra-easy policies, but it did stop projecting when inflation might get up to 2.0%. The inflation rates in the US, Eurozone, and Japan are currently 1.7% (core US PCED), 0.7% (Eurozone CPI), and 0.3% (core Japan CPI) (Fig. 1, Fig. 2, and Fig. 3).

The major central banks all are run by PhD macroeconomists as well as people like Jerome Powell at the Fed and Christine Lagarde at the ECB who have been surrounded by macroeconomists their entire careers. Most of the macroeconomists working at the central banks were trained as demand-side Keynesians. They believe that easy money should stimulate demand, which should revive inflation. That’s their core belief, in fact.

More specifically, easy money should boost consumer spending on durable goods and housing. It should stimulate capital spending by businesses. When the economy runs out of slack, that’s when it will run hot enough to heat up inflation. The central bankers admit that there has been more slack than they expected, but once the economy runs out of workers, wage inflation will rise, pushing price inflation higher, especially once capacity utilization gets to be tight enough. The Phillips Curve and output-gap models are variations of this demand-side view of the world.

There are two major flaws in this model: It fails to recognize that there are limits to how much debt demand-side borrowers can carry to keep buying stuff. And it completely ignores the impact of easy money on supply-side borrowers. Consider the following:

(1) Too much debt on the demand side. In the past, when demand-side borrowers had plenty of capacity to take on more debt, easy money effectively stimulated demand. It seems to have lost its effectiveness because monetary policy has been easy for so long, resulting in high debt-to-income ratios. Even historically low interest rates, which reduce the cost of servicing debt, don’t seem to be stimulating demand, which might explain why interest rates are historically low, of course.

(2) Too many zombies on the supply side. Meanwhile, supply-side borrowers, who produce the goods and services purchased by demand-side borrowers, can take advantage of easy money to refinance their debts at lower rates. Producers may also borrow more to keep their businesses going. The ones who are most likely to do so are the ones who would be out of business if they couldn’t borrow money. In other words, they are zombie businesses, i.e., the living-dead companies that won’t die because they are resuscitated by the cash infusions provided by their lenders. As long as they stay alive, they create deflationary pressures by producing more goods and services than the market needs.

And why are lenders willing to lend to the zombies? Instead of stimulating demand, historically low interest rates incite a reach-for-yield frenzy among creditors. They are willing to accept more credit risk for the higher returns offered by the zombies. Besides, if enough zombies fail, then surely the central banks will come up with some sort of rescue plan.

(3) Debt binges, now and then. It’s interesting to compare the borrowing binge in home mortgages that led to the Great Financial Crisis and the current borrowing binge in nonfinancial corporate (NFC) debt, including bonds and loans. At the start of 1990, the amount outstanding of both equaled around $2.4 trillion each (Fig. 4). Home mortgages then soared by 378%, or $9.0 trillion, to a record $11.3 trillion during H1-2008. Over the same period, NFC debt rose 162%, or $4.0 trillion to $6.4 trillion.

After peaking, home mortgages outstanding fell $1.4 trillion through Q1-2015, and then increased by $1.1 trillion to $11.0 trillion by Q2-2019. That was still slightly below the record high. Over the same period, NFC debt rose 55%, or $3.5 trillion, to a record $10.0 trillion.

During Q2-2019, NFC corporate bonds outstanding rose to a record $5.7 trillion (Fig. 5). NFC loans held by banks rose to a record $1.1 trillion, while “other loans” (which are mostly leveraged loans) rose to a record $1.8 trillion (Fig. 6).

The NFC data are less alarming when scaled by nominal GDP (Fig. 7 and Fig. 8). Home mortgages outstanding peaked at a record 77% of GDP during Q1-2009. NFC debt rose to a record high of 47% of GDP during Q2-2019.

(4) Central banks fueling deflation by feeding zombies. My interpretation of the data is that excessively easing credit conditions fueled the mortgage borrowing binge and housing boom that ended with the Great Financial Crisis. The strong debt-financed demand for homes stimulated economic activity and caused home prices to soar.

Since the Great Financial Crisis, the borrowing binge in NFC debt hasn’t contributed much to economic growth, and consumer price inflation has remained subdued. Apparently, a significant percentage of NFC debt is attributable to zombie companies using most of the proceeds from their borrowing to stay in business. The Fed’s May 2019 Financial Stability Report nailed it, as follows:

“[T]he distribution of ratings among nonfinancial investment-grade corporate bonds has deteriorated. The share of bonds rated at the lowest investment-grade level (for example, an S&P rating of triple-B) has reached near-record levels. As of the first quarter of 2019, a little more than 50 percent of investment-grade bonds outstanding were rated triple-B, amounting to about $1.9 trillion.”

The report also warned about leveraged loans as follows:

“The risks associated with leveraged loans have also intensified, as a greater proportion are to borrowers with lower credit ratings and already high levels of debt. In addition, loan agreements contain fewer financial maintenance covenants, which effectively reduce the incentive to monitor obligors and the ability to influence their behavior. The Moody’s Loan Covenant Quality Indicator suggests that the overall strictness of loan covenants is near its weakest level since the index began in 2012, and the fraction of so-called cov-lite leveraged loans (leveraged loans with no financial maintenance covenants) has risen substantially since the crisis.”

During his 10/30 press conference, Fed Chair Jerome Powell was asked about financial stability. He responded: “Obviously, plenty of households are not in great shape financially, but in the aggregate, the household sector’s in a very good place. That leaves businesses which is where the issue has been. Leverage among corporations and other forms of business, private businesses, is historically high. We’ve been monitoring it carefully and taking appropriate steps.”

He didn’t specify those steps. However, the Fed’s three interest-rate cuts are likely to feed the zombies’ appetite for more debt. In other words, the easy money provided by the Fed and the other central banks may be contributing to deflationary pressures attributable to supply-side borrowers. This would certainly explain why easy money has failed to boost inflation as expected by the proponents of demand-side models.

(5) Is a zombie apocalypse inevitable? If you want to read a very frightening script of how this horror movie plays out, see the October 2019 Global Financial Stability Report prepared by the International Monetary Fund. Here is the punchline: “In a material economic slowdown scenario, half as severe as the global financial crisis, corporate debt-at-risk (debt owed by firms that cannot cover their interest expenses with their earnings) could rise to $19 trillion—or nearly 40 percent of total corporate debt in major economies, and above post-crisis levels.”

There’s certainly lots to digest and think about in this unsettling report as the S&P 500 climbs to another record high. Apparently, investors expect that before doomsday arrives, even the Fed will lower interest rates close to zero again, allowing all the zombie borrowers to refinance their debts, thus postponing the zombie apocalypse.

Powell testified before the House Budget Committee on Thursday, 11/4. He said that he isn't worried about bubbles: “If you look at today’s economy, there’s nothing that’s really booming now that would want to bust.” He reassuringly added, “I think possibly the day of reckoning could be quite far off.”

I remain bullish on the economy and the stock market for now. But my contrary instincts are on full alert thanks to Powell. Stay tuned.

Friday, October 25, 2019

Lifestyle of the Rich & Famous President

The US economy continues to grow despite recurring recession scares. By my count, they’ve triggered 65 panic attacks in the stock market since the start of the bull market during March 2009. (See our S&P 500 Panic Attacks Since 2009 chart book and table.) The panic attacks—which include both corrections and mini-selloffs—have been followed by relief rallies. As a result, the S&P 500 remains near its record high of 3025.86 on 7/26 (Fig. 1).

The current economic expansion became the longest one on record during July of this year. It has now lasted 124 months. I expect it will continue through 2020. The main risk might be a radical regime change if President Donald Trump is defeated by one of the Democratic socialist candidates come the November 2020 election. Then again, our Founders reduced the chances that a radical president could be too radical by designing a constitutional system based on checks and balances.

I was intrigued and puzzled by the strange interview on CNBC with Nobel Prize-winning economist Robert Shiller a week ago on Friday. He said a recession may be years away due to Trump’s bullish impact on the economy. Shiller is a behavioral finance expert who apparently believes that consumers are following the President’s lead: “I think that [strong consumer spending] has to do with the inspiration for many people provided by our motivational speaker president who models luxurious living.” That’s certainly a different spin on the Trump presidency than I’ve heard before.

Shiller also said that the next recession may not hit for another three years, and it could be mild. If the economy remains strong, Shiller expects Trump to be re-elected.

Shiller coined the phrase “irrational exuberance” and correctly anticipated the bear market of 2000 because his CAPE valuation ratio was too high. He also correctly predicted the bear market in home prices that led to the Great Financial Crisis. His CAPE ratio is bearish again, yet he is bullish on the economy and the stock market.

In my opinion, consumers are doing what they do best because their real disposable incomes are growing along with employment and real wages. Consider the following:

(1) Growing wages driving consumer spending. My Earned Income Proxy for private-sector wages and salaries rose 4.2% y/y to a new record high during September, while retail sales rose 4.1% (Fig. 2). Trump’s policies of deregulation and tax cuts undoubtedly contributed to the strength in personal income.

(2) Trade wars and impeachment hearing causing uncertainty. On the other hand, Trump’s trade wars have created lots of economic uncertainty. So has his eccentric style of governing, which has led the House Democrats to start an impeachment hearing. The Democratic candidates all seem to favor higher taxes, including taxes on wealth.

(3) Consumers saving more. As a result, personal saving has soared. The 12-month sum of personal saving jumped by $335 billion from $969 billion during November 2017, when Trump was elected, to a record $1.3 trillion during August (Fig. 3). Over that same period, the personal saving rate rose from 6.5% to 8.1% (Fig. 4).

(4) Income growing faster than spending. Real disposable personal income has been growing faster than real personal consumption expenditures since May 2017 (Fig. 5). Since then through August, the former is up 7.8%, while the latter is up 6.6%.

I don’t disagree with Shiller on the longevity of the current economic expansion. However, I doubt that Trump’s lavish lifestyle is the role model for 99% of American consumers. The wealthiest 1% may be cutting back on their extravagant lifestyles and doing most of the saving, figuring that if Trump loses, they will be paying lots more in taxes.

Monday, October 21, 2019

Another Upside Hook for S&P 500 Earnings?

The Q3 earnings reporting season has started. Industry analysts’ estimates for the S&P 500 operating earnings per share plunged 8.7% from $44.85 at the end of last year to $40.93 during the 10/10 week (Fig. 1). As a result, the y/y growth rate in the consensus estimate for Q3 plummeted from 5.1% at the end of last year to -4.1% (Fig. 2).

It’s not unusual to see such downward revisions since industry analysts tend to be too optimistic about the future and become more realistic as the actual results approach during earnings-reporting seasons. Oddly, they tend to overshoot on the pessimistic side in the weeks before earnings seasons. That, in turn, means that there is often an earnings “hook” to the upside as actual results beat expectations.

I have weekly “earnings squiggles” data going back to Q1-1994. Of the 98 quarters since then through Q2-2019, there have been 77 such hooks by my count. (See S&P 500 Earnings Squiggles Annual & Quarterly.)

In addition to tracking the consensus earnings “squiggles” for each quarter, I do the same for the annual consensus earnings squiggles on a monthly basis (Fig. 3 and Fig. 4). They rarely show hooks, but they do confirm that analysts have an optimistic bias that gradually diminishes as each year progresses until their estimates converge with the actual annual results for S&P 500 companies.

My monthly data for the annual squiggles start in 1980, spanning 25 months from February to February. Of the 39 years since then through 2018, I count 30 years with descending squiggles averaging -17.8%. The 9 ascending ones, averaging 7.0%, tended to occur following recessions. Even optimistically inclined analysts tend to turn pessimistic during recessions. That sets the squiggles up for upside surprises during recoveries (Fig. 5).

Now let’s focus on the weekly data for the annual squiggles (Fig. 6). For the 10/10 week, they show that industry analysts expect that earnings per share will be up 0.8% y/y to $163.27 this year, up 11.2% to $181.53 next year, and up 9.2% to $198.23 in 2021. That puts S&P 500 forward earnings--which is the time-weighted average of consensus estimates for the current year and the coming year--at a record high of $177.67 during the 10/10 week.

Forward earnings tends to be a very good 12-month leading indicator for actual earnings as long as there is no recession over the next 12 months. If you agree with me that the economy should continue to grow through the end of next year, then forward earnings remains bullish for stocks.

Sunday, October 6, 2019

The Myth of Income Stagnation, Again

The key to a happy economic outlook and a continuation of the bull market in stocks is productivity growth. I think productivity growth is starting to make a comeback as the labor market gets tighter. If so, then wages—which have been rising faster than prices since the mid-1990s—would rise at a faster clip. Faster growth of real wages likely would more than offset the supply-side slowdown in payroll employment growth. A quicker pace of productivity growth would keep a lid on inflation. Profit margins would remain at recent historical highs or even go higher. The bull market in stocks would continue as earnings moved higher.

At a meeting recently in San Francisco with one of our accounts, I was asked to explain why an 8/7/18 Pew Research Center study disputed my claim that real wages have been rising for many years. The fellow came prepared with a copy of the piece, titled “For most U.S. workers, real wages have barely budged in decades.”

Right at the top is a chart showing that the purchasing power of average hourly earnings has been flat for 40 years! Can that possibly be right? Nope, it cannot be right. It makes absolutely no sense. In fact, it’s total nonsense. Consider the following:

(1) Agreeing on wage measure. The author of the study and I both focus on the average hourly earnings (AHE) of production and nonsupervisory workers. The series starts in January 1964, while the series for all workers is available only since March 2006. But the less comprehensive series has covered around 80%-84% of all workers and isn’t as skewed by the wages of top earners.

(2) Disagreeing on price measure. The Pew study divided AHE by the CPI indexed to 2018 dollars. It is well known that the CPI is upwardly biased, especially compared to the personal consumption expenditures deflator (PCED) (Fig. 1). Since January 1964 through August of this year, the CPI is up 728% while the PCED is up 539%, both indexed to 2018.

Over this same period, AHE is up 844%. Adjusted by the CPI, AHE was $22.90 during August, no higher than it was during late 1973, confirming Pew’s alarming and depressing headline (Fig. 2). Adjusted by the PCED, the AHE was the same, but up 48% over the same period!

(3) Making sense. The PCED-adjusted measure of the real wage makes much more sense. It rose during the second half of the 1960s before stagnating during the 1970s as a result of two oil price shocks and during the 1980s as a result of deindustrialization. It rebounded, along with productivity growth, during the second half of the 1990s in an uptrend into record-high territory since the late 1990s that persists to this very day.

Thursday, October 3, 2019

No Recession In Purchasing Managers Report

One of my favorite songs is “We Didn’t Start the Fire” (1989), by Billy Joel, who is one year older than I am. The lyrics are simply a long list of major personalities and issues that have pleased, pained, and plagued my generation—the Baby Boomers—since our parents started to have children during the late 1940s. The lyrics include brief, rapid-fire allusions to more than 100 domestic and global headlines during the Cold War, from 1949 through 1989. Many of them refer to troublesome events during that period.

Today, Billy Joel would have no trouble updating his list of troublesome events: Red China, North Korea, South Korea, vaccine, Ayatollah’s in Iran, foreign debts, homeless vets, China’s under martial law, impeachment, MMT, negative rates, deflation, inverted yield curve, M-PMI, and many more. Actually, the first eight items were in Joel’s original lyrics.

Yesterday’s cause for concern was the release of September’s M-PMI report. It wasn’t pretty. It was weak across the board (Fig. 1). Consider the following:

(1) Weak, but still no recession. The overall index fell to 47.8 from 49.1 during August. These are the first readings below 50.0 since 2016. There was no recession back then. The latest readings don’t signal a recession now according to the Institute for Supply Management (ISM), which conducts the PMI survey:

“A PMI® above 42.9 percent, over a period of time, generally indicates an expansion of the overall economy. Therefore, the September PMI® indicates growth for the 125th consecutive month in the overall economy, and the second month of contraction following 35 straight months of growth in the manufacturing sector. The past relationship between the PMI® and the overall economy indicates that the PMI® for September (47.8 percent) corresponds to a 1.5-percent increase in real gross domestic product (GDP) on an annualized basis.”

(2) Regional surveys also mostly down and out. The three major components of the M-PMI were all below 50.0 during September: new orders (47.3), production (47.3), and employment (46.3), as Debbie reviews below. The weakness in the M-PMI was confirmed by the composite and orders averages for the regional business surveys conducted by five Federal Reserve district banks (Fig. 2). However, the regional average employment index rebounded during September, while the employment component of the M-PMI fell to the lowest reading since January 2016 (Fig. 3).

(3) Trade war hits exports index. Also standing out on the weak side was the M-PMI’s new exports component, which plunged from last year’s peak of 62.8 during February to 41.0 during September (Fig. 4). That was the lowest reading since March 2009. Trump’s escalating trade war has depressed US exports, according to the latest ISM survey. The imports index, however, edged up from 46.0 during August to 48.1 last month.

(4) Bad news for S&P 500 revenues. The growth rate in S&P 500 aggregate revenues, on a y/y basis, is highly correlated with the M-PMI (Fig. 5). September’s reading for the latter suggests that the former could turn negative. That would imply negative earnings growth too. Aggregate revenues were up 3.0% during Q2.

The good news is that aggregate revenues growth is also highly correlated with the NM-PMI, which remained above 50.0 in September for the 122nd month, though is showing a slowdown in service-sector growth. September’s reading fell to a three-year low of 52.6 from 56.4 in August and a recent peak of 60.8 a year ago. However, ISM notes that an NM-PMI above 48.6, over time, generally indicates an expansion in the overall economy (Fig. 6).

Wednesday, September 25, 2019

As Germany Sinks, Draghi Promotes MMT

Germany's Homegrown Problems. IHS Markit has released its flash estimates for September’s Purchasing Managers’ Indexes (PMIs) in the Eurozone along with those for France and Germany. The German data were downright ugly. There’s no oomph or oompah in Germany. Instead, manufacturing has fallen into a recession and is dragging down the rest of the economy. Real GDP edged down 0.3% (saar) during Q2 and is up just 0.4% y/y (Fig. 1). Another q/q decline is likely during Q3.

In the Eurozone, Markit estimates that the Composite PMI (C-PMI) fell from 51.9 during August to 50.4 this month (Fig. 2). The drop was led by the Manufacturing PMI (M-PMI), which is down from a recent peak of 60.6 during December 2017 to 45.6 this month. However, the Nonmanufacturing (NM-PMI) also contributed to the month’s decline, falling from 53.5 to 52.0. Germany stands out with an M-PMI that is now down to 41.4 compared to 50.3 in France (Fig. 3). Also weakening in Germany is the NM-PMI, which is down from this year’s high of 55.8 during June to 52.5 in September (Fig. 4).

I’ve previously observed that there is something wrong with Germany’s economy. Trump’s trade wars may be part of the problem, but Germany—along with most of the rest of the world—has a serious homegrown problem: not enough babies and too many seniors. Babies tend to stimulate consumption as they grow older, while old people don’t stimulate much of anything. It’s hard to stimulate people who are already old to do much of anything.

That may explain the weakness in global auto sales in recent years (Fig. 5). Germany’s manufacturing economy is particularly dependent on the auto industry. Let’s have a closer look at Germany’s economy:

(1) Tougher emission standards. In the Eurozone, regulators made things worse for the industry with new emission standards imposed a year ago. The new EU-wide test procedure was the authorities’ reaction to VW’s 2015 admission to widescale cheating on diesel vehicles, with suspicions since spreading to other manufacturers.

(2) Losing cache. Germany’s high-performance and high-priced Bimmers and Benzes may not be as popular with Millennials around the world as they were with the Baby Boomers. Millennials tend to be minimalists. They are more concerned about fuel economy and are likely to favor electric vehicles once EVs become cheaper and have more range.

(3) Competing with Chinese EVs. A 9/20 Bloomberg article titled “China Is Winning the Race to Dominate Electric Cars” hits on several of the issues plaguing Germany’s automakers. For starters: “The global auto market is not only not growing, but it is also shrinking. Sales peaked in 2017 at nearly 86 million on a trailing-12-months basis; right now in 2019, sales are closer to 76 million.”

The future for the auto industry is EVs, which are mostly made in China: “There is only one company in the top 10 by percent of electric passenger vehicle revenue that isn’t Chinese: Japan’s Mitsubishi Corp. Two Chinese automakers get more than 40% of revenue from electric vehicle sales; a third gets nearly a quarter of its revenue from EVs.”

(4) Fiscal stimulus coming? In August, German Chancellor Angela Merkel said she sees no need for a stimulus package “so far” but added that “we will react according to the situation.” She pointed to plans to remove the so-called solidarity tax, an added income tax aimed at covering costs associated with rebuilding the former East Germany, for most taxpayers.

(5) Green new deal. The problem is that the government plans to spend $60 billion through 2030 on green new deals, which are more likely to weigh on the economy than to stimulate it. According to the 9/20 WSJ article on this subject:

“The measures, including subsidies for green power generation, will be financed by revenues from higher taxes on polluting activities, such as air travel and car fuel, as well as a new carbon emission certificate trading scheme to be launched in 2021. The package won’t affect Germany’s balanced budget. Despite international pressure on Berlin to loosen the purse strings and revive a slowing economy, the country’s budget surplus is projected to stand at over €40 billion in 2019.”

The government will help to finance more than a million charging stations for EVs by 2030. Owners and buyers of EV cars will get government subsidies, which might further depress gasoline-powered auto sales.

Draghi Saying Give MMT a Chance. Outgoing ECB President Mario Draghi told European lawmakers that Modern Monetary Theory (MMT) should be considered to stimulate the slowing economy of the Eurozone. “It’s a government decision, not [that of] the central bank,” he said. During his tenure, Draghi’s monetary policy commitment to “do whatever it takes” to save the Eurozone economy hasn’t been enough, so I am not surprised that before his 10/31 departure he is calling on fiscal policy to save the day.

The basic tenet of MMT is that a government may borrow and spend to infinity and beyond because it controls the creation of money. Under MMT, governments can never run out of money to pay their debts, say MMT advocates. They would only cease MMT if inflation heated up.

On his way out the door, Draghi set the stage for MMT in the Eurozone by lowering the ECB's official deposit rate from -0.40% to -0.50% and restarting the asset-purchase program. The ECB is set to buy €20 billion per month in Eurozone securities, including government bonds.

It is unlikely that German leaders will readily take the advice of the ECB, let alone its outgoing president, to consider an idea like MMT. Officials of the EU’s largest economy deeply value fiscal discipline. They undoubtedly will protest that MMT violates the principles of the Maastricht Treaty, the official treaty on the European Union signed in 1992, which emphasizes sound fiscal policies and limits on debt.

Thursday, September 12, 2019

US Bond Yields Made in Germany

Another round of central bank easing is underway. So why are bond yields rising?

The 10-year US Treasury bond yield rose from a recent low of 1.47% on 9/4 to 1.72% on Tuesday (Fig. 1). The record low was 1.37%, hit on 7/8/16 just after the Brits voted to leave the European Union (EU). The risks of a no-deal Brexit have eased in recent days, though it still could happen next month. A hard Brexit could cause the bond yield to retest its recent low.

In any event, the main reason that the US bond yield has moved higher in recent days has more to do with Germany than the UK. The 10-year German government bond yield has risen from a recent record low of -0.71% on 8/30 to -0.54% Tuesday. Reuter’s reported: “Germany’s 30-year government bond yield briefly rose into positive territory on Tuesday for the first time in over a month, lifted by expectations for fiscal stimulus and caution over the scale of stimulus the European Central Bank might deliver this week.”

During a parliamentary budget debate on Tuesday, Germany’s Finance Minister Olaf Scholz said that Germany can counter a possible recession with a big stimulus package. On Monday, Reuters reported that Germany was considering creating a “shadow budget” to boost public investment above and beyond limits set by its national debt rules, sparking a bond sell-off.

European Central Bank (ECB) President Mario Draghi has been lobbying for fiscal policy to turn more stimulative to support the ECB’s ultra-easy monetary policies. Germany has resisted doing so and even questioned whether the ECB’s asset purchase program could legally buy sovereign bonds. Germany’s fiscal and monetary conservatives might be starting to waver as a result of Germany’s intensifying manufacturing recession, with factory orders and production down 5.6% and 4.8% y/y through July (Fig. 2).

Last year, when there was widespread bearishness in the bond market, with some predicting that the US yield would rise from 3% to 4%-5%, I observed that the US bond yield might be “tethered” to the comparable German and Japanese yields, which were barely above zero. This year, both have dropped solidly below zero.

During the Q&A portion of his 7/25 press conference, Draghi pleaded for more fiscal stimulus, especially from Germany:

“What’s hitting the manufacturing sector in Germany and [elsewhere in Europe is] an idiosyncratic shock. Here what becomes really very important is fiscal policy. [T]he mildly expansionary fiscal policy is supporting activity in the euro area. But if there were to be a significant worsening in the Eurozone economy, it’s unquestionable that fiscal policy … becomes of the essence. … I started making this point way back in 2014 in a Jackson Hole speech: monetary policy has done a lot to support the euro area … but if we continue with this deteriorating outlook, fiscal policy will become of the essence.”

Thursday, September 5, 2019

From FOMO to FONIR

I visited with our accounts in Atlanta and Chattanooga recently. They seemed relatively calm. Most of them believe that the US economy can continue to grow for the foreseeable future. So they aren’t freaking out about the recent inversion of the yield curve. However, they are somewhat anxious about the prospect of negative interest rates in the US, though they think it is a remote possibility. Consider the following:

(1) US bond yields stand out. We discussed in our meetings the expectation that the Bank of Japan (BOJ) is likely to keep its official policy interest rate at -0.10% for the foreseeable future, as it has since 1/29/16, while the Governing Council of the European Central Bank (ECB) is likely to lower its official deposit rate, currently -0.40%, deeper into negative territory at its 9/12 meeting (Fig. 1). The ECB is widely expected to resume quantitative easing at that meeting as well (Fig. 2).

Such expectations have driven the 10-year German government bond yield down to -0.70% on Monday from 0.24% at the start of this year. At 1.50% on Friday, the 10-year US Treasury bond yield is literally outstanding compared to the comparable yields available overseas: UK (0.34%), Japan (-0.27), Sweden (-0.34), France (-0.40), Germany (-0.70) (Fig. 3). The negative-interest-rate policies (NIRPs) of the ECB and BOJ are increasing the amount of negative-interest-rate bonds (NIRBs) around the world.

(2) Dividend & earnings yields stand out. The rationale for remaining bullish on US stocks seems to be shifting from TINA (there is no alternative) and FOMO (fear of missing out) to FONIR (fear of negative interest rates). These fears are inherently bullish for stocks and continue to overcome the bearish fear that an inverted yield curve is predicting an impending recession, i.e., FOIYC (fear of inverted yield curve).

A few of the accounts with whom I met recently noted that the 10-year US Treasury bond yield at 1.50% is below the S&P 500 dividend yield, at 1.90% during Q2-2019 (Fig. 4). That is one very good reason why they remain mostly fully invested in the stock market. I observed that the forward earnings yield of the S&P 500, at 6.06% during August, is even more outstanding compared to the bond yield (Fig. 5).

(3) Performance derby. The 119bps drop in the US bond yield since the beginning of the year certainly has benefited dividend-yielding stocks. The S&P 500 sectors that tend to have lots of dividend-paying companies have outperformed those that tend to have fewer of them: Information Technology (28.0% ytd), Real Estate (26.0), Consumer Discretionary (20.3), Communication Services (20.0), Consumer Staples (19.0), Utilities (17.6), Industrials (17.4), S&P 500 (16.7), Financials (12.6), Materials (11.9), Health Care (4.6), and Energy (-0.5) (Fig. 6).

FONIR should continue to benefit dividend-yielding stocks. Their high valuation multiples reflect investors’ willingness to pay up for these stocks, as evidenced by the relatively high forward P/Es of the S&P 500 sectors with lots of dividend payers: Real Estate (44.0), Consumer Discretionary (21.2), Information Technology (19.6), Consumer Staples (19.6), Utilities (19.4), Communication Services (17.4), Materials (16.9), S&P 500 (16.8), Industrials (15.4), Health Care (14.8), Energy (14.7), and Financials (11.4) (Fig. 7).

(4) Real yields. During July, the US bond yield averaged 2.05%, while the CPI inflation rate was 1.80%. So the inflation-adjusted bond yield was close to zero, at 0.25% (Fig. 8). During August, the bond yield fell below the inflation rate. In other words, in real terms, bond yields are entering negative territory. Meanwhile, the real earnings yield of the S&P 500, using reported earnings, remained solidly in positive territory during Q2-2019, at 3.02% (Fig. 9). The real forward earnings yield of the S&P 500 was 4.03% during July (Fig. 10).

Wednesday, August 28, 2019

Trump's Game of Chicken

President Donald Trump seems to be playing simultaneous games of chicken with Fed Chair Jerome Powell and Chinese President Xi Jinping. Last Friday, he raised tariffs again on US imports from China and ordered US companies to leave China. He also said that Fed Chair Jerome Powell is a greater enemy than Xi. Trump’s game plan is to create more uncertainty about trade, thus increasing the risks for US economic growth so that the Fed will have to respond with more interest-rate cuts. At the same time, he hopes that Xi will relent by agreeing to a trade deal that is good for the US economy.

Games of chicken are often reckless and dangerous, with dire consequences. The S&P 500 tumbled 2.6% on Friday. In the classic movie “Rebel Without a Cause” (1955), Jimmy (played by James Dean) agrees to a “chickie-run” to settle a dispute with Buzz, the leader of a local gang. Both race stolen cars toward the edge of a cliff. The first to jump out of his car is branded a “chicken.” Jimmy flings himself out an instant before the cars reach the edge of the cliff. Seconds into the race, Buzz discovers that his jacket is stuck on the door handle. So he goes over the cliff and dies.

The question for all of us is whether Trump is Jimmy or Buzz. Is Trump trumping Powell and Xi or is Trump trumping Trump?

Our 7/11 Morning Briefing was titled “Powell Gets Trumped!” I wrote: “President Donald Trump wants the Fed to lower interest rates. Fed Chair Jerome Powell claims that the Fed is independent and won’t bow to political pressure. Yet Trump has figured out the perfect way to force the Fed to lower interest rates. All he has to do is keep creating uncertainty about US trade policy. In his congressional testimony yesterday on monetary policy, Powell mentioned the trade issue eight times in his prepared remarks.”

Sure enough, the Fed lowered the federal funds rate by 25bps on 7/31. However, that afternoon, Trump said that it wasn’t enough and that he wants more easing right away. Trump was quick to attack the Fed’s decision. He tweeted: “What the Market wanted to hear from Jay Powell and the Federal Reserve was that this was the beginning of a lengthy and aggressive rate-cutting cycle which would keep pace with China, The European Union and other countries around the world. … As usual, Powell let us down, but at least he is ending quantitative tightening, which shouldn’t have started in the first place—no inflation. We are winning anyway, but I am certainly not getting much help from the Federal Reserve!”

The very next day, Trump trumped Powell again by creating more uncertainty about trade when he said that the US will impose a 10% tariff on an additional $300 billion worth of Chinese imports next month. The new tariff comes on top of the 25% levy that Trump already has imposed on $250 billion worth of Chinese imports—so the US will be taxing nearly everything China sends to the US. Trump added that the tariffs could be raised to 25% or higher if the talks drag on further without any significant progress, but he allowed that alternatively they could be removed if a deal is struck.

Then on 8/14, stocks rebounded after the Trump administration de-escalated its trade war with China. The 10% tariff would be delayed until 12/15 on imports from China of cellphones, laptop computers, toys, and other items. No reason was given. Trump trumped Trump.

In our 8/7 Morning Briefing, I wrote: “What does Trump want? He wants to win another term on 11/3/20. What does Xi want? He wants Trump to lose. They both know that. Xi is president for life, so he figures he can easily outlast Trump, though having to deal with Trump through 2024 would be more challenging than through 2020. Trump must know that even if he gets a deal with China before the election, that won’t mean much if he loses. He seems to be talking up the scenario of a post-election deal, perhaps believing that timing will yield a better deal from the Chinese, assuming he wins a second term.”

I concluded in that commentary: “Trump must figure that he needs the Fed to lower interest rates while he waits for the Chinese to come around on trade, hoping to strike a deal after the elections.” Trump’s game is to trump Powell before he trumps Xi.

By the way, Bill Dudley is apoplectic about Trump's game of chicken. Dudley served as president of the Federal Reserve Bank of New York and as vice chairman of the Federal Open Market Committee from 2009 to 2018. He revealed his antipathy for the President in a 8/27 Bloomberg View op-ed titled “The Fed Shouldn’t Enable Donald Trump.”

He wants the Fed to fight fire with fire: “I understand and support Fed officials’ desire to remain apolitical. But Trump’s ongoing attacks on Powell and on the institution have made that untenable. Central bank officials face a choice: enable the Trump administration to continue down a disastrous path of trade war escalation, or send a clear signal that if the administration does so, the president, not the Fed, will bear the risks—including the risk of losing the next election.”

In other words, the Fed shouldn’t offset the uncertainties caused by Trump’s trade policies with lower interest rates, even if that leads to a recession. The Fed should refuse to meet its legal mandate to maintain full employment and price stability rather than enable Trump.

Dudley is essentially calling for the Fed to overthrow the President in the coming election: “There’s even an argument that the election itself falls within the Fed’s purview. After all, Trump’s reelection arguably presents a threat to the U.S. and global economy, to the Fed’s independence and its ability to achieve its employment and inflation objectives. If the goal of monetary policy is to achieve the best long-term economic outcome, then Fed officials should consider how their decisions will affect the political outcome in 2020.”

I am almost speechless. Dudley may be calling on the Fed to join the resistance and to fight fire with fire, but that would be playing with fire for the Fed. Welcome to the New Abnormal, where everyone loses their minds! Trump has the amazing ability to make sane people go insane. (For more on this, Google search “Trump Derangement Syndrome.”)

Wednesday, August 21, 2019

Bonds In Neverland

The negative interest rate policies of the European Central Bank (ECB) and the Bank of Japan (BOJ) have created a Neverland in the global fixed-income markets. An 8/18 Bloomberg story reported: “The world’s headlong dash to zero or negative interest rates just passed another milestone: Homebuyers in Denmark effectively are being paid to take out 10-year mortgages. Jyske Bank A/S, Denmark’s third-largest lender, announced in early August a mortgage rate of -0.5%, before fees. Nordea Bank Abp, meanwhile, is offering 30-year mortgages at annual interest of 0.5%, and 20-year loans at zero.”

A 7/29 story in The Washington Times reported: “The latest estimates are that approximately 30 percent of the global government bond issues are now trading in negative territory. Last week, Swiss 50-year borrowing costs fell below zero percent, which means that Switzerland’s entire government bond market now trades with negative yields. Earlier in the month, Denmark became the country to have its entire yield curve turn negative.”

During 2018, when the 10-year US Treasury bond yield was rising toward last year’s high of 3.24% on 11/8, there was much chatter about its going to 4%-5%. For example, on 8/4 at the Aspen Institute's 25th Annual Summer Celebration Gala, JP Morgan Chase Chief Jamie Dimon warned that the 10-year US Treasury bond yield could go much higher: “I think rates should be 4% today. You better be prepared to deal with rates 5% or higher—it's a higher probability than most people think.”

At the time, the bears worried about mounting federal deficits, resulting from the tax cuts at the beginning of the year, at the same time that the Fed was on track for more QT. In addition, there was mounting evidence that inflationary pressures were building, with some related to Trump’s tariffs.

In my 8/8/18 daily commentary, I wrote: “So why isn’t the US bond yield soaring? The bulls respond that trying to forecast the bond market using flow-of-funds supply-vs-demand analysis has never worked. It’s fairly obvious that US bond yields are tethered to comparable German and Japanese yields, which are near zero, and are likely to remain there given the stated policies of both the ECB and BOJ to keep their official rates near zero for the foreseeable future.”

The tether has gotten tighter since last year’s peak in the US bond yield on 11/8. Since then, the US bond yield has dropped 164bps to 1.60% on Monday, while the comparable German and Japanese yields are down 111bps to -0.65% and 36bps to -0.23%, respectively.

Now consider the following related developments in the US bond market:

(1) Tipping into negative territory. The 10-year TIPS yield dropped to zero on Monday, suggesting that the nominal yield reflects only inflation expectations with no real yield. The TIPS yield could be about to turn negative, as it did in 2012.

(2) Real rates and productivity. Why should the real bond yield be negative or even zero? The most widely accepted notion is that the real bond yield should be related to the growth rate in productivity, which is the economy’s real return, arguably. The correlation between the two—using averages over five-year time periods—is not compelling, though. In any event, productivity growth has been turning up over the past few years. Productivity has been growing faster in the US than in the other G7 economies.

(3) Demography is destiny. The geriatric trend in global demographic profiles does support a case for negative nominal and real interest rates if the trend leads to a combination of slow growth and deflation. That’s if deflation reduces the value of assets purchased today with debt. Negative interest rates on that debt might reflect the voluntary self-extinction of the human race attributable to the collapse of fertility rates around the world. Dwindling populations, particularly of younger people, will put downward pressure on real asset prices, because there will be less demand for the goods and services they provide in the future.