Thursday, September 29, 2011

Capital Goods Orders & Shipments

One of our accounts is puzzled. On the one hand, he is reading about the weakness in so many economic indicators. He notes that many economists are raising their odds of a recession. On the other hand, he follows lots of capital goods companies. Their managements are still saying that their business is very good. Though I don’t expect a recession, I have been writing about the ongoing soft patch in many of the business cycle indicators.

However, my friend’s upbeat assessment of durable goods manufacturing is confirmed by the latest orders and shipments data. They remained remarkably durable through August. Let’s review some good news for a change:

(1) Capital goods shipments jump to cyclical high. Durable goods orders are still well below their early 2008 record high, both including and excluding the volatile transportation industry. Yet in August, shipments of nondefense capital goods excluding aircraft (NDCGx) jumped 2.8% to match the previous two cyclical peaks in 2000 and 2008. This category largely determines the capital spending component of GDP. Over the past three months, the three-month average of NDCGx shipments is up 15.3% (saar), the fastest pace since July 2010.

(2) Capital goods orders are also robust. NDCGx orders rose 1.1% in August, also matching the previous two cyclical peaks. Over the past three months, the three-month average of these orders is up 8.7% (saar).

It’s hard to put a negative spin on such strong numbers, other than to note that they looked this strong during the previous two cycles when they peaked and then took a dive. On a more fundamental basis, capital spending is driven by corporate profits and cash flow, which have been very strong. They should remain strong, though both are likely to grow at slower paces through next year.

Given that there still seems to be plenty of underutilized capital and labor in the US, the pace of capital spending is impressive. It is likely to slow given the slower pace of overall economic growth recently. However, exports should continue to account for an increasing share of durable goods orders and shipments. The global economy is slowing too, but it’s a big world.

Wednesday, September 28, 2011

US Economic Indicators


I’m not getting good vibes from the latest batch of US economic indicators. Let’s have a close look at the ones for the labor markets and the manufacturing sector. One of my favorite monthly indicators of the labor market is especially disturbing. In its monthly survey of consumer confidence, the Conference Board asks their respondents whether jobs are available, plentiful, or hard to get. The percentage saying that “jobs are hard to get” (JHTG) is highly correlated with the unemployment rate. In August, it increased to 50% from 44.8% in July. Its most recent low was 42.4% during April 2011. So the labor market has actually been deteriorating every month for the past three months, according to this measure. It gets worse: The latest reading is the highest since May 1983. And that’s after the White House spent $880 billion aimed at creating 3.7 million jobs over the past two and a half years. We certainly didn’t get our money’s worth.

The JHTG indicator is also highly correlated with the four-week average of initial unemployment claims. The former is likely to be closely related to the pace of hiring, while the latter is more closely tied to the pace of firing. Of course, hiring and firing activities are also related. If businesses are cutting back on hiring again, they are more likely to be firing more workers again.

So I am concerned that initial unemployment claims could soon be heading higher again. If that doesn’t happen, it will be because most businesses slashed their payrolls in 2008 and 2009 and didn’t turn around and rehire everyone they let go. Still, the high correlation between JHTG and the jobless rate is unnerving given that the former is the highest in almost three decades.


This coming Monday, the ISM national survey of manufacturing purchasing managers will be released for September. The results are used to calculate the manufacturing purchasing managers index (M-PMI). This index was down to 50.6 during August, from this year’s high of 61.4 during February. I expect it will remain around 50.

If there is a surprise, it is more likely to be on the downside than the upside. I base this on the three regional surveys of manufacturers currently available through September that are conducted by the Federal Reserve Banks of Philadelphia, New York, and Richmond, as shown above.

This average tends to exceed zero when the economy is growing and to fall below zero when the economy is contracting. At least that’s been the limited history of this average since it first became available during July 2001. This year, it peaked at 25.6 during March. Then, it plunged to -16.1 during August, the lowest reading since April 2009. In September, it edged up to -10.8. So it remained significantly below zero. Notice that the M-PMI didn’t take a dive below its breakeven of 50 during August. So it might have continued to hold its own in September.

Tuesday, September 27, 2011

Earnings of S&P 500 & Financials

Investors aren’t the only ones who are struggling to assess the Euro-Mess. This problem has unsettled business planners around the world, as evidenced by lots of weakening global business indicators. On Monday, October 3, purchasing managers surveys for September will be released for most of the major economies. Preliminary surveys released last week suggest that most purchasing managers indexes remained relatively weak around 50. If so, that would be consistent with positive, but rapidly slowing, growth in corporate earnings.

In the upcoming earnings season, I expect that the S&P 500 companies will report that their aggregate earnings totaled $23.25 per share, up 6.9% y/y. A year ago, this growth rate was 32.9%. Two weeks ago, the bottom-up consensus was $25.04, up 15.1% y/y. This estimate has declined from a peak earlier this year of $25.63 (up 17.8% y/y) during the week of June 3.

During the past nine earnings seasons, there was also a tendency for analysts to lower their estimates for the quarter in the weeks just before the start of the earnings season. In each quarter, their downwardly revised estimates were easily beat by reported earnings. This time, the downward revisions have been more pronounced over the past few weeks. Also this time, Joe and I expect that the consensus is going into the earnings season with estimates that may be too high rather than too low.

Speaking of revisions, the S&P 500’s consensus earnings estimate for 2012 fell again last week, for the seventh consecutive week, to $111.33. Forward earnings has been flat for the past seven weeks. Contributing most to the downward revisions is the Financials sector. The chart below shows the percent changes in the 2012 earnings estimates for the sector and six of its major industries. Here are the highlights: (1) The 2012 consensus estimate for the S&P 500 Financials was down 8.9% ytd during the week of September 15. (2) The worst- to best-performing industries based on the ytd changes in earnings expectations are Investment Banking & Brokerage (-21.2%), Other Diversified Financial Services (-16.3), Asset Management & Custody Banks (-10.1), Diversified Banks (-5.4), Regional Banks (-2.2), and Consumer Finance (+13.8).

Monday, September 26, 2011

Commodity Prices


Last week’s plunge in commodity prices may be a harbinger of much weaker economic activity. There could be more downside for commodity prices this week after the CME said in an email, after trading closed Friday, that gold margins will be raised by 21%, silver margins by 16%, and copper margins by 18%, effective at the close of trading Monday. The price of a barrel of Brent plunged 6.0% last week to $105.65, the lowest since August 10. The good news is that these declines in commodity prices will boost the purchasing power of consumers and producers, and will lower headline inflation rates around the world.

Last week, I suggested that the price of copper might retest its June 7, 2010 low of $2.76 per pound. This morning, it is down again to $3.21. The price of gold is down again this morning to $1,614 an ounce, putting it 14.8% below its record high of $1,895 on September 5-6. Where might the price of gold find support? It should do so at its 200-day moving average, which was $1,524 on Friday.

There is mounting evidence that the global economy is slowing. It doesn’t add up to a double dip just yet. But the risk is that it might be heading in that direction. I don’t like what I am seeing in our favorite indicator of global economic activity. The CRB raw industrials index plunged last week by 4.3%, led by a 9.0% drop in its five metals components. It is still 3.4% above its previous cyclical high on April 29, 2008 and 17.3% above last year’s low on February 8, where it is most likely to find support, in our opinion. This index is also highly correlated with the S&P 500 Transportation Index, which plunged 9.1% last week.

Thursday, September 22, 2011

The Twist

Monetary policy is twisted. Operation Twist is supposed to push bond yields closer to zero, which should reduce mortgage rates and revive housing activity. QE-1.0 was supposed to do the same thing. But it didn’t work. Housing remains in a depression even though the Fed purchased $1.24 trillion in mortgage-related securities from November 25, 2009 through the end of March 2010. Operation Twist is supposed to force investors to buy riskier securities, especially stocks, with the expectation that will somehow stimulate economic growth. QE-2.0 was supposed to do the same thing. But it didn’t work either, which is why the Fed is doing the twist.

Ten-year Treasury yields and mortgage rates were already at record lows before yesterday’s Operation Twist announcement. Yet housing remains depressed. The mortgage applications index for both new and existing home purchases remained at the lowest levels since 1995, based on 4-week average. It is actually 8% lower than a year ago and 42% lower than two years ago despite the drop in mortgage rates. The housing problem can’t be fixed with record low mortgage rates.

Actually, the Fed isn’t sure how Operation Twist will work to boost the economy. And how do we know this? The Fed said so in its FAQs: “The maturity extension program will provide additional stimulus to support the economic recovery but the effect is difficult to estimate precisely."

Wednesday, September 21, 2011

Copper, Oil, & the S&P 500

The price of copper dropped sharply yesterday after the IMF lowered its global growth estimate. It also fell sharply on Monday, down 20 cents over the two-day period from $3.92 cents per pound on Friday to a ten-month low of $3.72 yesterday. It is up at $3.74 this morning, trading 11.8% below its 200-dma. That's bad news because it suggests that this summer’s crisis of confidence caused by the debt messes in Europe and the US is depressing global economic activity. It suggests that the global soft patch is rapidly getting softer, confirming the IMF’s downgrade of the global growth outlook.

Yesterday’s FT reported: “Rio Tinto, one of the world’s largest natural resources companies, has warned that some of its customers were asking to delay shipments of metals, in a clear sign that the financial turmoil is starting to affect the commodities sector.” This is a rather sudden shift from six weeks ago when many mining companies were still seeing plenty of demand for their commodities.

Falling commodity prices are bad for profits and for stock prices. The S&P 500 has been very highly correlated with both the price of copper and the price of crude oil since 2008. The good news is that the price of a barrel of Brent crude oil remains near the year’s high. However, it is down a bit and right on top of its still rising 200-day moving average. Also keep in mind that stock prices may already have discounted the recent weakness in commodity prices. Nevertheless, it’s hard to see much upside for stock prices if commodity prices remain weak. Of course, if they tumble, then there will be more downside for stocks.

If the IMF forecast is correct, then there should be enough global growth to avert a 2008-style plunge in the prices of commodities, including the prices of copper and oil. This doesn’t rule out a retest of copper’s 2010 low of $2.76 on June 7. The price of oil is less likely to retest last year’s low of $69.19 on May 25. That’s because OPEC would cut production if the price weakens much from current levels.

Tuesday, September 20, 2011

S&P 500 Valuation


Previously, on several occasions, I argued that the stock market’s valuation multiple may have more to do with the perception of America’s leadership in the world and the leadership of America. Most recently, in the August 4 Morning Briefing, I noted the similarities between the disappointing leadership provided by Jimmy Carter and Barack Obama, though they both won the Nobel Peace Prize. At 11.3, today’s forward P/E is still above the 6-8 range during the Carter years. But it did drop sharply in recent months along with Mr. Obama’s popularity.

What about interest rates and inflation rates? They soared during the Jimmy Carter years. Now both are extremely low, but that doesn’t mean that they are necessarily bullish for valuation. Today’s two charts compare the S&P 500’s forward P/E to the expectations component of the Consumer Sentiment Index (CSI) and the expected inflation rate in the 10-year TIPS market since 2007. Here are some obvious observations:

(1) The CSI’s expectations component fell to 47.0, the lowest level since March 1980 during the first two weeks of September. Guess who was president back then? During August, the forward P/E was 11.4, the lowest since February 2009. It isn’t much higher than the previous cyclical low of 10.4 during October 2008. Gallup reports: “Americans’ current level of economic confidence--which represents their views on the current state and future direction of the nation’s economy--is decidedly negative. Seventy-seven percent said the economy was getting worse in August, the highest--by far--since February 2009, the month in which Congress passed a $787 billion stimulus bill in hopes of lifting the U.S. economy out the depths of the recession.”

(2) During the 1980s and 1990s, falling inflation and interest rates were bullish for valuation. However, those rates were much higher than they are now. Today, these rates are much closer to zero, and falling inflation and interest rates raise the specter of a deflationary depression, which would be a very bearish scenario. That explains why there has been a very close fit between expected inflation in the 10-year TIPs and the forward P/E. The former fell from a 2011 high of 2.62% during the week of April 15 to 1.94% last week. Over this same period, the P/E dropped from 12.8 to 11.0.

Sunday, September 18, 2011

Global Financial Stress Indicators


US money market funds have stopped lending to European banks. That’s evidenced by the $74.9 billion decline from $282.1 billion to $207.2 billion in the commercial paper outstanding of foreign financial issuers over the past 12 weeks through September 14. This funding squeeze must have worsened last week, prompting the ECB to start borrowing dollars from the Fed and three other central banks and loan the proceeds to European banks on an unlimited basis through the end of the year.

That action averted an immediate meltdown of the European banking system. Indeed, the FTSE Eurofirst 300 Banks Euro Index was down 32.7% ytd a week ago. Last week it rose 3.7%, with a jump of 8.8% from Tuesday through Friday. Unfortunately, coordinated central bank liquidity support can’t fix the underlying problem for European banks. They are holding large amounts of the bonds issued by debt-challenged European governments. If rescue measures fail to stabilize the finances of these governments, then the banks will need massive injections of new capital. Some might have to be nationalized, which would worsen the finances of their governments.

Thursday, September 15, 2011

Stock Market Indicators


Perhaps the most likely explanation for the rebound in stock prices so far this week is that sentiment has turned too bearish and that the market was oversold and due for a bounce. Yesterday, it was reported that the Bull/Bear Ratio (BBR) fell to 0.87 this week. That’s the fifth straight weekly decline to the lowest reading since August 2010. Stocks have often rallied following such low readings. Our Fundamental Stock Market Indicator (FSMI), which has been highly correlated with the S&P 500 since 2000, has declined for four of the past five weeks since early August through the week of September 3 by 5.4%. At its low on August 8, the S&P 500 was down 13.4% from the end of July and trading at a 29-month low of 13.2% below its 200-day moving average. Yesterday, the S&P 500 closed 7.6% below its 200-dma. There may be some more upside in the near term given the low reading of the BBR.


Wednesday, September 14, 2011

Tax receipts & the Economy

Among the most widely neglected indicators of the economy are the tax revenues data series published in the Monthly Treasury Statements of Receipts and Outlays. We track the data and believe they provide useful insights into the economy in general and into consumers and profits in particular. What we are seeing in the latest data through August is surprising strength in the growth of individual income tax receipts and significantly weakening growth in corporate profits receipts. To smooth out seasonal volatility, we track the 12-month moving sums. Let’s review:

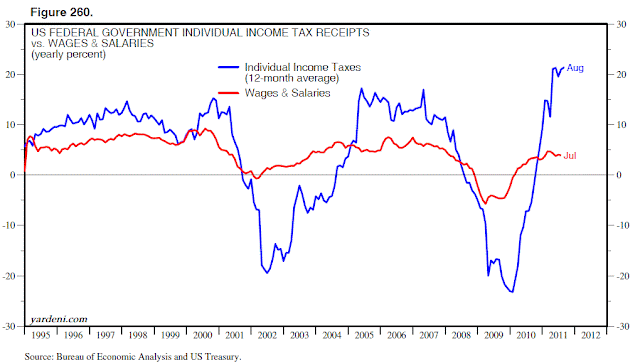
(1) There is certainly no soft patch or double dip in individual personal income tax receipts. The 12-month sum rose to $1,084.4 billion during August. That’s up 21.3% y/y, which is the highest growth rate since the summer of 1979. This series is highly correlated with the yearly percent change in nominal wages and salaries in personal income.  

(2) On the other hand, the growth in corporate profits tax receipts is slowing significantly. Over the past 12 months through August, these receipts totaled $191.2 billion, and are up 11.7% y/y. That’s down sharply from the most recent cyclical peak growth rate of 60.9% during January. The growth rate of the 3-month sum of these receipts was down 7.0% on a y/y basis.

Tuesday, September 13, 2011

S&P 500 Earnings & the M-PMI

October should provide a very interesting Q3 earnings season. We have been very bullish on the past nine earnings seasons. We have our concerns about the tenth one. We won’t be surprised if there are more negative earnings surprises this time and lots of cautious guidance about Q4’s outlook. The biggest negative is likely to be that sales and earnings in Europe slowed significantly during the quarter, and are likely to worsen over the rest of the year.

US domestic sales and earnings could also be disappointing given the weakness in all the Fed and ISM surveys of business during July and August. There is a strong correlation between S&P 500 operating earnings on a year-over-year basis and the ISM purchasing managers index (PMI) for manufacturing. This index dropped from the most recent cyclical high of 61.4 during February to 50.6 during August. This suggests that the year-over-year growth rate in S&P 500 operating earnings is heading towards zero, unless there is a surprising rebound in the PMI over the rest of the year.

S&P 500 operating earnings was $24.85 per share during Q2, up 18.9% y/y. Industry analysts are currently forecasting $25.04 for Q3, which would be up 15.1% y/y. They expect earnings to be up 15.1% during Q4 and 13.7% during all of next year. Again, these forecasts are likely to be too optimistic if purchasing managers indexes remain subdued in the US and if European economies remain depressed. We are predicting that earnings will be up only 5.3% next year.


Monday, September 12, 2011


The dollar might soar again. Three years ago, Lehman and AIG blew up. That led to a flight away from counterparty risk and a flight to quality. The US Dollar Index soared from a low of 71.99 during the summer of 2008 to a peak of 89.54 on March 4, 2009. During the first round of the European sovereign debt crisis, the index rose from 74.95 on November 30, 2009 to 88.71 on June 7, 2010. Signs of financial stress are mounting again, and could once again be bullish for the dollar. Let’s review:

(1) Foreign official and international accounts deposited $102.8 billion at the Fed, up sharply from $57.6 billion at the start of the year, and well above the previous high of $88.9 billion during the week of January 7, 2009.

(2) The flight to quality is most apparent in the plunge in 10-year government bond yields around the world to record lows. This morning these yields are at 0.92% in Switzerland, 1.00% in Japan, 1.66% in Sweden, 1.71% in Germany, 1.89% in the US, 2.11% in Canada, 2.19% in the UK, and 2.47% in France. On the other hand, yields are much higher among the credit-challenged governments of Spain (5.19%), Italy (5.44%), and Greece (18.56%).
 
(3) At the end of last week, the high yield spread in the US widened to 651bps from 416bps at the beginning of the year. It is the widest since November 30, 2009. This spread is an excellent leading economic indicator and suggests that the outlook is deteriorating.


Thursday, September 8, 2011

S&P 500 Sectors: Forward & 2012 Earnings

Today’s charts show the percentage changes in the S&P 500’s forward earnings and 2012 consensus estimates since the beginning of the year for the 10 sectors. Keep in mind that as we approach the end of the year, forward earnings will converge to equal the 2012 estimate at the end of this year. Through the week of September 1, forward earnings for the sectors are mostly up year-to-date as follows: Energy (33.7%), Materials (21.4), Industrials (15.8), Information Technology (15.5), Consumer Discretionary (10.6), Consumer Staples (6.2), Health Care (5.1), Financials (4.2), Utilities (-0.9), and Telecommunication Services (-1.0).
 
A similar pattern can be seen in the 2012 estimates. However, estimates for Financials (down 6.3% ytd) and Telecommunication Services (down 9.8% ytd) have been falling since the start of this year.


Wednesday, September 7, 2011

Global Purchasing Managers Indexes


The 4% jump in Germany’s industrial production during July was very good news. But it was also old news. Germany’s manufacturing purchasing managers index (M-PMI) fell to 50.9 in August, the lowest reading since September 2009 and well below the most recent cyclical peak of 62.0 during April. The other major M-PMIs all confirmed that global manufacturing growth stalled in August. We construct a Global M-PMI by averaging the indexes for the US, the UK, the Eurozone, and China. This super index fell to 49.9 in August from 50.3 in July. It is down from the most recent cyclical peak of 58.4 during February.


Does this mean that the global economy is on the verge of double dipping? I don’t think so. Rather, I expect that M-PMIs may continue to fluctuate north of 50 over the rest of this year into next year. Keep in mind that the PMIs are diffusion indexes. That means they cycle. Readings of 50 mean that most purchasing managers are saying that business was as good this month as it was last month.


Meanwhile, purchasing managers in nonmanufacturing industries remain relatively upbeat. The Global NM-PMI was 53.4 in August. That’s down from 54.8 in July, and the recent cyclical peak of 57.9 during March. But it is solidly above 50.


Tuesday, September 6, 2011

US Employment Indicators

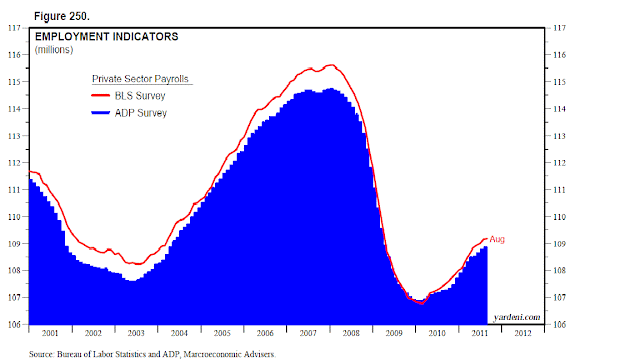
You don’t need me to tell you about all the bad news in August’s employment report. So let’s try hard to find some of the good news in that report released by the Bureau of Labor Statistics (BLS). Private sector payrolls are up 142,400 per month on average over the past 12 months. That’s certainly subpar, but a recovery nonetheless. According to the ADP survey of private payrolls, employment rose 91,000 during August, outpacing the official increase of 17,000. During the first eight months of this year, these payrolls are up 1.16 million with small, medium, and large companies adding 603,000, 508,000, and 45,000 to their payrolls.

Private sector payrolls bottomed during February 2010. They are up 2.4 million over that 18-month period. Over the same period of the previous recovery in this measure of employment, it rose 2.5 million.


The pace of hiring could actually improve in coming months. The Monster Employment Index rose 3 points in August to 147, the highest reading since October 2008. Last month’s advance was led by increases in natural resources, healthcare, and retail trade. The following industries were at cyclical highs during August: manufacturing, construction, transportation & warehousing, retail, information, educational services, and healthcare & social assistance. While the hiring situation could deteriorate rapidly, it did not do so in August.