Wednesday, February 16, 2011

China's Currency

Every five years, the National Bureau of Statistics conducts a major revision of the way it measures inflation. It did so with the release of January’s CPI on Tuesday. There was a 4.2 percentage point increase in the share of housing costs in the basket of consumer goods used to measure inflation. The weightings of a series of other items were lowered, notably food, which it cut by 2.2 percentage points. In December, China’s CPI rose 4.6% y/y, compared with November’s 5.1%, which was the fastest in more than two years. According to the official data, annual consumer prices rose 4.9% in January. Economists polled by Reuters had expected 5.3%. Food prices rose 10.3%. Excluding food, the CPI rose 2.6%, the highest in the history of the series going back to 2002, and led by a 6.8% increase in housing costs. Rents are rising rapidly in China, along with wages.

So why don’t the Chinese let their currency appreciate already? That way, they won’t be flooding their banking system with reserves, so higher reserve requirements will actually tighten the availability of credit. Imports will be cheaper priced in local currency terms, which would also relieve some inflationary pressures. Exports might be depressed, but that might encourage manufacturers to produce more products for domestic rather than foreign consumption. So why don’t the Chinese stop pegging the yuan? Well, apparently they may have stopped doing just that without telling anyone. The yuan was pegged around 6.82 yuan/dollar from July 18, 2008 through June 18, 2010. Since then, it has been moving higher, and is now around 6.59 yuan/dollar. The last time that the Chinese allowed their currency to appreciate was from July 22, 2005 to July 11, 2008, when it rose 19.8%. I think they’ve started to do it again.


Monday, February 14, 2011

Consumer Sentiment


The Consumer Sentiment Index for high-income families increased for the fourth time in five months from 71.4 in September to 88.2 in mid-February. That’s the best reading since December 2007, and well above the October 2008 low of 57.8. They must be benefitting from the 27.2% increase in the S&P 500 since Mr. Bernanke first mentioned QE2 on August 27, 2010 at the Fed’s annual meeting in Jackson Hole. That amounts to capital gains of $3.18 trillion based on the Wilshire Index. Of course, high-income families must also be pleased that Congress extended the Bush tax cuts for another two years. Washington has been very good to high-income families.


The Consumer Sentiment Index for low-income families reversed nearly all of its recent gains, falling from 72.1 in January to 67.7 in mid-February. Its recession low was 53.3 during November 2008. It has been fluctuating between 64 and 73 since April 2009. Low-income families are not likely to be benefitting from the rally in stocks. They probably remain more vulnerable to long-term unemployment and wage cuts. To add insult to injury, Mr. Bernanke’s focus on core inflation is irrelevant to most of them. Food and fuel costs matter to them more than to high-income families.


Sunday, February 13, 2011

Transportation Stock Indexes


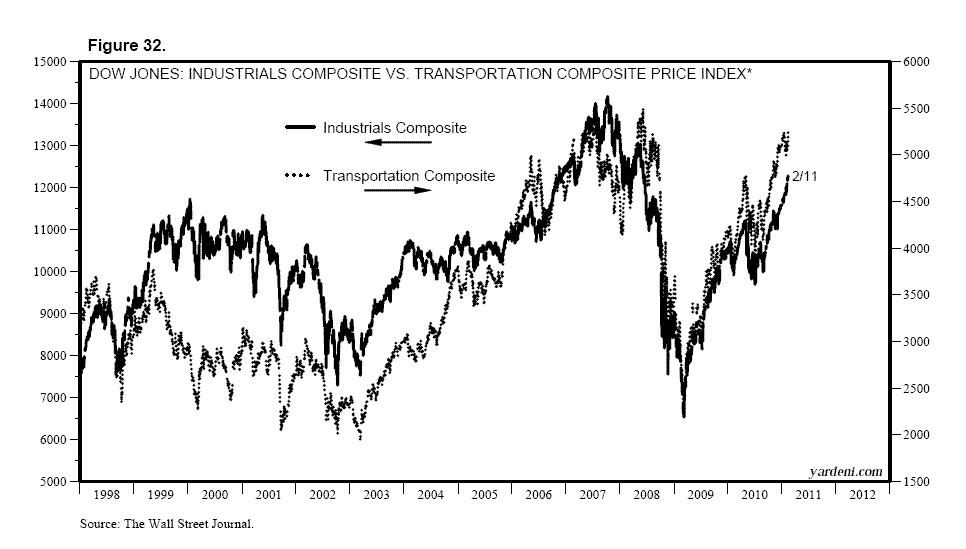
The Dow Jones Transportation Average (DJTA) rose last week to a cyclical high. Dow Theory technicians are most bullish when a rising DJIA is confirmed by its DJTA cousin.


The S&P 500 Transportation Index rose to another record high at the end of the week. It was led by another record high for the Railroads industry.


Wednesday, February 9, 2011

Small Business Survey


SBOI rose for the fifth time in six months, climbing from 88.1 in July to 94.1 in January, the highest reading since the end of 2007. Seven of the 10 indicators were up in January, one down, and two unchanged. Earnings trends and sales expectations were the biggest positive contributors.


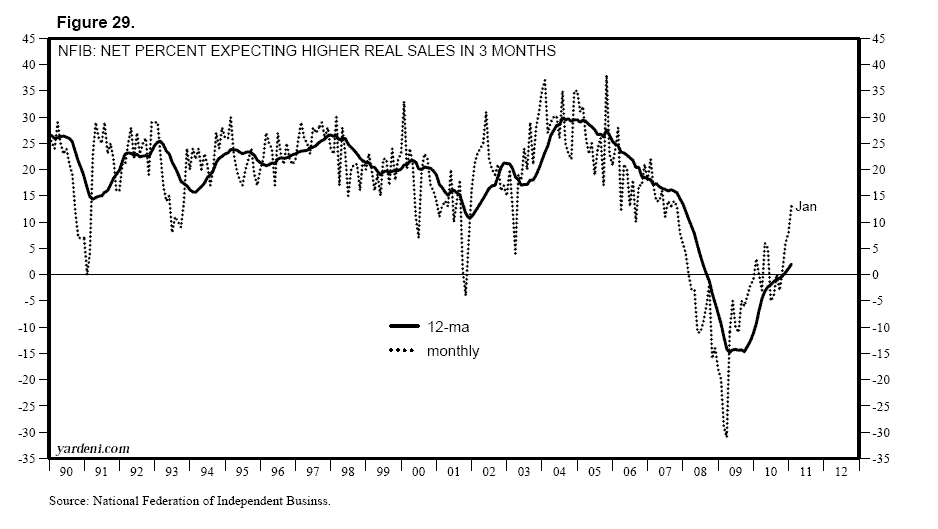
The net percent of small business owners expecting gains in real sales volumes improved for the fourth straight month from a net negative 3% in September to a net positive 13% in January, the highest since October 2007. The 12-ma is back in positive territory.
 

Tuesday, February 8, 2011

Fundamental Stock Market Indicator

Is our Fundamental Stock Market Indicator (FSMI) still a good coincident indicator for the S&P 500? We think so. Our FSMI is the average of the Weekly Consumer Comfort Index (WCCI) and our Boom-Bust Barometer (BBB). It gained 2.0% during the final week of January, recovering two-thirds of the loss the prior two weeks. Before the recent decline, it had increased 21 out of 23 weeks. The FSMI is back within 1.2% of its recent high for the cycle.

 
The BBB, which is the ratio of the CRB raw industrials spot price index to the 4-week average of jobless claims, has driven the move up in the FSMI, though it has been in a volatile flat trend in recent weeks as the 4-wa in jobless claims moved steadily higher since the start of the year. Meanwhile, the CRB raw industrials spot price index remains on its vertical ascent. The WCCI plunged 5 points during the first week of February, erasing all the improvement in the early weeks of this year.