Tuesday, July 12, 2011

Education and Employment

Employment among adults with college degrees increased 720,000 over the past 12 months to 44.9 million. Over this same period, total household employment increased 242,000. Employment among adults with some college experience has increased by only 58,000 over the past year.

The labor force among adults with only a high school diploma declined by 460,000 over the past 12 months as their employment dropped by 164,000. The labor force is dropping even faster among adult workers with less than a high school degree. It fell 654,000 over the past 12 months. Over the same period, their employment is down 580,000.


The unemployment rate for adult workers with a BA and higher degrees was only 4.4% in June, unchanged from a year ago and well below the national average of 9.2%. At the start of 2009, their unemployment rate was as low as 3.9%. It has been relatively stable just above this low rate since then. The unemployment rate for adults with some college or an associates degree was 8.4% in June. That’s about the same as a year ago, but up from a recent low of 7.4% in March.

The unemployment rate has remained stubbornly high for adults with only a high school education. It was 10.0% in June, only slightly below 10.7% a year ago. Adults without a high school degree are dropping out of the labor force faster than any other group, as their jobless rate remains over 14%.


Sunday, July 10, 2011

US Employment Indicators

According to the Bureau of Labor Statistics (BLS), payroll employment rose only 18,000 during June. May’s gain was also disappointing at 25,000, which was a downward revision from 54,000. Those were both far weaker than April’s increase of 217,000, which was also revised down from 232,000. Were there any disappointing months during the previous economic expansion? Yes there were. In 2004, payroll employment rose only 43,000 in February and 47,000 in July. In 2005, the weakest increase was 63,000 in September. In 2006, there was a small 11,000 gain in May and an 8,000 decline in October.


The index of aggregate hours worked in private industry fell 0.3% overall during June. It was led by a 0.7% drop in manufacturing, which was the first one-month decline since December. Again, a temporary shortage of parts had to be the culprit. Despite June’s decline, the three-month average of the index of aggregate hours worked was still up 3.3% (saar) during Q2 vs. Q1. Normally, that would suggest that real GDP probably rose at least as fast, and probably faster if productivity increased during the quarter. Nevertheless, we are sticking with our conservative projections of 2% for both Q2 and Q3, with a jump of 4% or more during Q4.


Thursday, July 7, 2011

Soft Patch & Stock Prices

There was a soft patch during the previous global economic expansion. The Global Super Composite PMI--which we calculate by averaging the manufacturing and non-manufacturing PMIs for the US, UK, and EU--rose from a March 2003 recession low of 47.9 to a cyclical peak of 57.9 during January 2004. It then dropped back down to a 2005 low of 51.7 during May of that year before recovering to another cyclical peak of 57.1 during April 2006. It then hovered around 55 through August 2007 before starting a huge dive down to a record low of 37.6 during December 2008. What did stock prices do during the previous expansion’s soft patch? The S&P 500 rose during 2004 and early 2005, building on the bull market that had started in early 2003.

So far during the current expansion, there was a brief soft patch last year in the Global Super Composite PMI, which declined from a peak of 56.7 during April to a low of 53.9 during September. The S&P 500 dropped 16.0% from April 23 through July 2. Concerns about a possible double dip were exacerbated by the sovereign debt crisis in the eurozone.

But then the Super PMI rebounded to a new cyclical peak of 58.5 during February 2011. It then dropped to 53.2 during June. Meanwhile, stock prices have held up remarkably well following the rally from July 2 through April 23. We expect that the Super PMI will rebound during the second half of this year much the same as it did last year. If so, then stock prices should end the year higher than today.


Auto sales are down sharply in recent months. There are two obvious explanations. The first is that the spike in the national average price of a gallon of gasoline to a peak of $3.96 depressed sales. The other is that a shortage of parts from Japan following the March 11 earthquake disrupted production and reduced the supply of models available for sale by auto dealers. Of course, it is likely that both explanations caused the drop in sales.

The parts shortage should be over soon. The pump price is still high, but it was down to $3.56 during the week of June 29. At least, no one is talking about it rising to $5 a gallon. We expect a big rebound in auto sales during the last four months of the year.

Total retail motor vehicle sales peaked during February at 13.4 million units (saar). They fell 14.9% to 11.4 million units during June. Over this same period, domestic light truck sales declined by 0.5 million to 5.0 million; domestic car sales dropped by 0.8 million to 3.9 million; and imported models fell by 0.7 million to 2.5 million.

The decrease in imports was probably largely attributable to the plunge in exports of cars from Japan following the earthquake and tsunami. The decline in domestic car sales might have reflected both a shortage of parts and less interest in buying a car when gasoline prices were rising rapidly. Interestingly, sales of light trucks, which tend to be less fuel efficient, dropped the least, suggesting that parts shortages played a bigger role than higher gasoline prices in depressing sales in recent months.


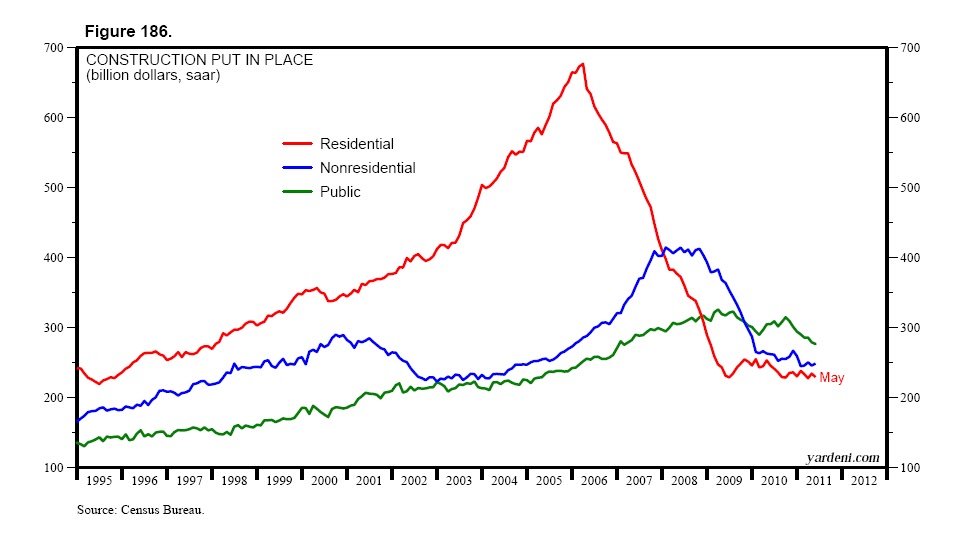
The rebound in the Super PMI should be led by a rebound in the global auto industry, including the one in the US. One US industry that is likely to remain stuck in the mud is construction. Indeed, the value of total construction put in place fell to a new recession low for the industry during May. It was $753.5 billion (saar), down 37.9% from the record high during March 2006 and the lowest since September1999. Here are a few more details on the sorry state of this industry:

(1) The weakest sector in the industry remains residential construction. It peaked at a record $676.4 billion during March 2006. After crashing through 2008, it has been in a coma, flat-lining slightly south of $250 billion since late 2009.

(2) Nonresidential construction has also been flat-lining slightly north of $250 billion since early 2010. Its hay days were during 2008, when spending was hovering around $400 billion.

(3) Another clunker has been construction spending by the public sector. Despite all the money spent to stimulate the economy by Washington from 2009-2011, little of it stimulated public construction. Indeed, in May it was $276.3 billion, the lowest since February 2007 and actually down from a record high of $325.5 billion during March 2009.

Wednesday, July 6, 2011

Purchasing Managers Indexes

There are some hard spots in the soft patch. That’s why stock prices rallied so nicely last week. The DJIA jumped 153 points on Thursday after June’s Chicago purchasing managers index (PMI) came in at 61.1, up from 56.6 in May. The national manufacturing PMI was released Friday morning, helping to boost the DJIA by another 168 points by the end of the day. It rose from 53.5 in May to 55.3 in June. However, the components of the index suggest that supply disruptions were still weighing on manufacturers, as the production index edged up by only 0.5pps to 54.5. The inventories index contributed the most to the overall PMI, rising 5.4pps to 54.1, suggesting that the parts shortage may end soon.

The eurozone’s M-PMI fell to 52.0 in June from 54.6 in May. Germany’s PMI dropped to 54.6, only the second reading below 60.0 since November. The French index slipped to 52.5 last month from 55.0 in May. The UK’s PMI dropped to a 21-month low of 51.3 last month. Compounding the gloom, manufacturing in Italy, Ireland, Spain, and Greece all contracted in June, as their PMIs were below 50. China’s M-PMI was weak again in June, falling to 50.9, the lowest reading since February 2009. However, the production index was still at 53.1. The overall index should rebound in July and August as the Japanese parts shortage problem comes to an end.