Sunday, August 7, 2011

Super PMIs

When the monthly manufacturing and non-manufacturing purchasing managers indexes (M-PMIs and NM-PMIs) are released, we average them together for the US, the UK, and the EU. These series have the most history going back to the late 1990s.

The Super M-PMI fell every month since its most recent cyclical peak of 60.6 during February. It was down to 50.1 during July. That may be a harbinger of a global manufacturing recession. More likely is that it is a soft patch mainly attributable to the disruptions caused to global manufacturing by the shortage of Japanese parts following the March 11 earthquake. There was a mid-cycle slowdown during 2005, when the Super M-PMI dropped to a low of 48.7. It then recovered and remained above 50.0 during the final months of 2005 through early 2008. The Super NM-PMI remained relatively strong at 53.2 during July, though that was down from a recent peak of 57.2 during March.


The Super-Duper PMI, which averages the Super M-PMI and the Super NM-PMI, fell to 51.7 in July. That is down sharply from the most recent cyclical high of 58.5 during February, and the lowest reading since September 2009. But it is still north of 50.0. The July level matches the low during the 2005 mid-cycle slowdown. The next couple of months will determine whether the soft patch is turning into a mud pit or into a hard patch. We remain in the soft-patch camp. We think that the recent weakness is a mid-cycle slowdown. It is possible that the soft patch was extended by all the crazy political turmoil in Europe and in the United States during July. The resulting crisis of confidence, which was reflected in last week’s market plunge, might have prolonged the slowdown. The downgrade of US government debt by S&P may also prolong the soft patch.


Thursday, August 4, 2011

Valuation & Gold


America is starting to have a problem that long dogged comedian Rodney Dangerfield, who often complained: “I don’t get no respect.” On Monday according to Reuters, Vladimir Putin had the following to say about the recent debate in Washington between the Democrats and Republicans about raising the debt ceiling and reducing the deficit: “Thank god that they had enough common sense and responsibility to make a balanced decision.” He added, “They are living beyond their means and shifting a part of the weight of their problems to the world economy.” To add insult to injury, he complained: “They are living like parasites off the global economy and their monopoly of the dollar.”

China’s official news agency, Xinhua, which often voices the true feelings of the country’s political elite, described the recent battles over the Washington debt deal as a “madcap farce of brinkmanship.” The commentary, published in many Chinese newspapers, went on to warn the US that it must implement more responsible policies if it is going to solve its problems. And it warned that the emergency debt bill thrashed out between Democrats and Republicans “failed to defuse Washington’s debt bomb for good, only delaying an immediate detonation by making the fuse an inch longer.”

It has been my view for some time that the stock market’s valuation multiple is directly related to the geopolitical stature of the United States. The US certainly wasn’t standing tall during the late 1970s when Jimmy Carter was the President. The P/E of the S&P 500 hovered between 7 and 8 times forward earnings as inflation and interest rates soared during the second oil crisis. In Iran, the Shah was deposed by Islamic revolutionaries who held 52 Americans as hostages for 444 days from November 4, 1979 to January 20, 1981.

The P/E rose during the 1980s under President Ronald Reagan, who supported Paul Volcker’s tough anti-inflationary monetary policies, while stimulating economic growth with lower tax rates. President Reagan along with President George H. W. Bush pursued foreign policies that led to the collapse of the Soviet Union, marked by the removal of the Berlin Wall during 1989, when the P/E was over 10.

The US won the Cold War and emerged as the world’s sole superpower during the 1990s. The P/E spiked up to 15 after the end of the first Gulf War in early 1991. It then soared under President Bill Clinton to finish the 1990s around 25. America was the epicenter of the high-tech revolution, and had an entrepreneurial economy that was widely admired. Inflation was low and so were interest rates. Congress held a hearing in February 2001 to discuss what to do about huge projected federal government surpluses!

Then the tech bubble burst. Enron imploded in late 2001. Terrorists attacked the US on 9/11, and the P/E was down to 22.1 by the end of 2001. During July 2002, Worldcom filed for bankruptcy, and the P/E fell to 15.3 by the end of that month. These companies and others were brought down by accounting scandals. The federal budget outlook deteriorated rapidly when President George W. Bush pushed for tax cuts to stimulate the economy while launching wars in Iraq and Afghanistan. That was the beginning of the end of Pay-Go and fiscal discipline in Washington.

The P/E continued to decline during the bull market from 2003 through 2007, led by a steady drop in the valuation multiples of large-cap tech stocks. Investors learned from the 1990s tech bubble to pay less for rising earnings. Then, the financial crisis hit. Lehman blew up during September 2008. The P/E dropped to a low of 9.3 during October 2008. It was back up around 14 during the second half of 2009 and the first four months of 2010, as the economy recovered from a very severe recession. It then dropped again to just below 12 on mounting concerns about a double dip in the US and a sovereign debt crisis in Europe during the spring and summer of 2010, before rising back up to 13.

The budget situation only got worse under President Barack Obama as he resorted to a massive Keynesian fiscal stimulus program to revive economic growth. It didn’t work. In July of this year, the P/E was back down to 12. After Monday’s selloff, it was down to 11.7. Investors are fretting that the economy is stalling and that Washington is too politically paralyzed and too deep in debt to help. Washington may actually worsen the situation as the Republicans push for spending cuts, while the Democrats push for tax increases.

Could the P/E drop back below 10? Unfortunately, it could if more investors see more similarities between Jimmy Carter and Barack Obama. Thirty-two years ago on July 15, 1979, Carter delivered his depressing “crisis of confidence” speech, in which he berated the way of life of Americans and questioned our values. In his mind, the oil shock of that year and soaring inflation were our fault. The speech was later dubbed the "malaise speech," even though Carter never used that word. Here is a link to a remix,” showing the extraordinary similarities between Carter’s speech and numerous similar preachy statements made by Obama in some of his speeches to the nation.

In the chart above, you can see that there is a long-term inverse correlation between the P/E versus the inflation-adjusted price of gold, which is approaching the record high of $866 per ounce during January 1980, when Carter was President. This does not bode well for the valuation multiple. The real price of gold was $682 during June. To match the 1980 peak on an inflation-adjusted basis, it would have to rise over $2,500 in current dollars. If it gets there, odds are that the P/E will be lower.


Wednesday, August 3, 2011

US Consumer Indicators

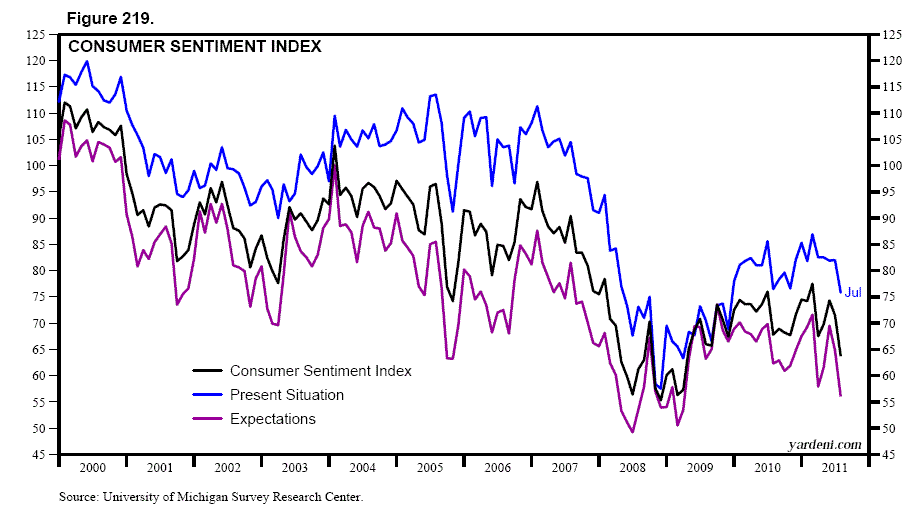
Thomson Reuters/University of Michigan final index of consumer sentiment fell to 63.7, the weakest since March 2009, from 71.5 in June. The Michigan survey’s index of current conditions, which reflects Americans’ perceptions of their financial situation and whether it is a good time to buy big-ticket items like cars, decreased to 75.8 from 82.0 the prior month. The index of consumer expectations for six months from now, which more closely projects the direction of consumer spending, dropped to 56.0 from 64.8.

The Conference Board Consumer Confidence Index, which had declined in June, improved slightly in July. The index now stands at 59.5 (1985=100), up from 57.6 in June. The Present Situation Index decreased to 35.7 from 36.6. The Expectations Index rose to 75.4 from 71.6 in June. There was certainly plenty of bad news during July that explains why consumers were so depressed.

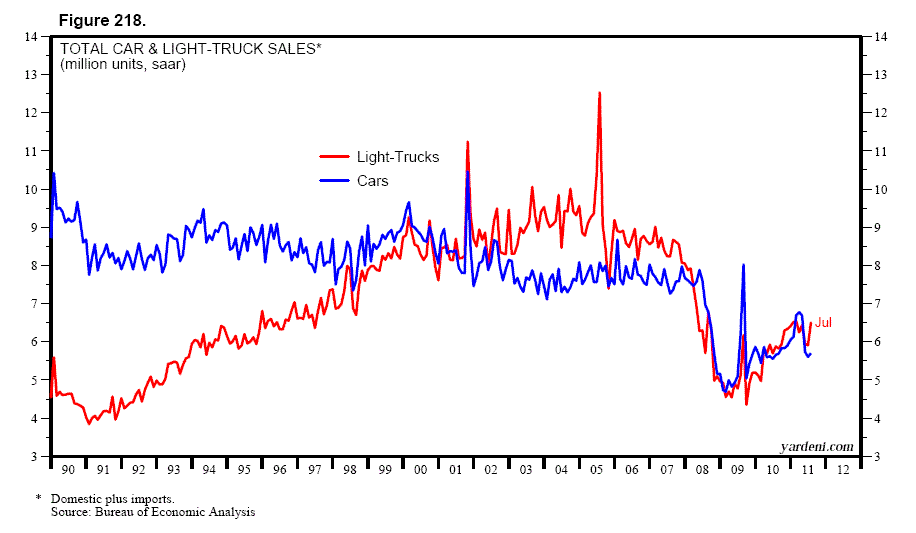
While Q2 corporate profits have been very strong, the markets have focused on all the weak macroeconomic news. It’s hard to find much good news among the pile of bad macro news, as discussed in today’s Morning Briefing. Until yesterday, all we had was the drop in initial unemployment claims below 400,000 during the last week of July. This morning, we have July’s motor vehicle sales, which rose to 12.2 million units (saar) from 11.5 million units during June.

The gain was led by light-truck sales, which increased from 5.9 million units in June to 6.5 million units in July, back at February’s pace, which was the best since the summer of 2008. Overall sales should continue to improve as the shortage of imported models is relieved in coming months. The share of imports in total sales dropped to 22.4% during July, the lowest since March 2006.


Monday, August 1, 2011

S&P 500 Earnings & Valuation

Why is the stock market holding up so well? Corporate revenues and profits continue to fly despite the weakness in US economic growth. That’s because companies are finding lots of both around the world. While nominal GDP was up only 3.7% y/y during Q2, the revenues of the 337 S&P 500 companies that have reported their Q2 results are up 13.1%. They are up 16.0% excluding the Financials (and Bank of America's big hit during the quarter).

Industry analysts seem to be tuning out the bears. There’s no sign of any stalling in bottom-up earnings forecasts. The S&P 500 consensus estimate for 2012 actually rose during the last week of July to a new high of $113.78 per share, up 15.0% from the latest estimate for 2011, which edged up last week and continues to hover around $100. As a result, S&P 500 forward earnings, which is a time-weighted average of the current and coming years’ earnings estimates, also rose to a new record high last week of $107.50.


Let’s say that the economy doesn’t stall during the second half of the year and that forward earnings converges with the 2012 estimate at $115 by the end of the year. That would put the S&P 500 at 1380 if the forward P/E remains at last week’s 12.0. If the P/E rises to 13.0, the S&P 500 would finish the year at 1495, very close to my “1500 for the 500” target. Of course, if the soft patch is turning into a mud pit rather than a hard patch, as suggested by the latest GDP and ISM reports, then earnings would tank and so would the P/E. That’s not my forecast, but it certainly is a credible risk given the latest data.


Sunday, July 31, 2011

Fixing the Economy


Now that Washington seems to be on the verge of a debt deal, it's time to do something that might actually work to boost economic growth. I will soon meet with my Congressman to pitch one idea for doing so that was inspired by my friend Carl Goldsmith, the chief investment officer of Delta Asset Management. I met with Carl and his colleagues last Wednesday in his office in Los Angeles. Carl rightly observes that one of the main drags on the US economy is the housing industry. In the past, it always rebounded from recessions with V-shaped recoveries, which would boost overall economic growth. This time, the industry remains in a deep recession, which is weighing on the overall economy’s recovery.

Housing starts have been hovering between 475,000 and 690,000 units per month, at seasonally adjusted annualized rates, since the end of 2008. That’s the slowest pace on record, which starts in 1959. Payroll employment in the construction industry has plunged 2.22 million from a record high of 7.73 million during April 2006 to 5.51 million during June.  There must be lots of construction workers among the 6.3 million Americans who have been without a job for more than 27 weeks, i.e., the long-term unemployed.

Carl and I agree that the best way to revive economic growth is to quickly reduce the huge overhang of unsold homes that is depressing both home prices and construction activity. During June, the inventory of single-family existing homes on the market totaled 3.31 million units. There may be another million houses that are in the process of foreclosure or are heading in that direction. Our plan is simple and cost effective:

(1) The federal government should provide a $20,000 matching subsidy toward a down payment on a house to any homebuyer who puts up at least the same amount and is approved for a mortgage loan. The program would be capped at two million existing single-family homes. So the cost of the program would be $40 billion. The purchased property would have to be the primary residence of the buyer.

(2) This program could be paid for by slashing the corporate tax rate on repatriated foreign earnings from 35% to 10%. We estimate that doing so could easily raise the $40 billion necessary to finance the program. Moody’s research recently estimated that at least half of US companies’ record $1,240 billion in cash balances is held overseas. It’s over there and not here because of the large repatriation tax. In recent conversations with top executives of several major US technology companies with cash overseas, Carl was assured that lowering that tax to 10% would bring most of the money to the US.

(3) Rental income would be tax free for 10 years for homebuyers who purchase existing single-family houses as rental properties. They would not be eligible for the down payment subsidy. The 10-year tax-free status of the rental income would be transferable to new owners during that period. The number of rental units under the program would be capped at one million.

The Obama administration has opposed lowering the repatriation tax, arguing that a similar program during 2004, when $300 billion returned to the US, was paid out to shareholders rather than invested in job creation. Our proposal would use the tax revenues from repatriated corporate profits to fund the down payment subsidy program. Combined with the incentive to new landlords, we believe that the overhang of unsold homes could be eliminated within a year. That should set the stage for a significant revival in home building and construction employment.

On May 20, 1862, Congress passed the Homestead Act, which accelerated the settlement of the western territory by granting adult heads of families 160 acres of surveyed public land for a minimal filing fee and five years of continuous residence on that land. Our New Homestead Act should be a win-win for all of us by accelerating the recovery in the housing market. We welcome your thoughts, which will appear in the comments section of the blog.