Wednesday, June 29, 2011

S&P 500 Sectors Relative P/Es


Today’s charts show the forward P/Es of the 10 S&P 500 sectors relative to the overall market’s valuation multiple on a daily basis, though based on weekly forward earnings data for the sectors. Stable sectors are all trading at or near recent cyclical high P/Es. Since the market bottomed during March 2009, there has been a rally in the valuations of the Stable sectors. Among the Stable sectors, Telecom Services is the most expensive, selling at more than a 30% premium to the market. The cheapest of the Stable sectors is still Health Care. It is selling at a small discount after selling at very large discounts during 2009 and 2010. In the past it sold at a premium. However, yesterday’s court ruling in favor of ObamaCare may put a lid on the sector for a while.

Among the Cyclical sectors, Energy is the cheapest with a discount of 14%. However, it tends to trade at a discount to the market. Financials is also selling at a discount, which is also par for the course. Given the big hit to Bank of America and the ongoing mess in the mortgage market, this sector may remain earnings challenged for a while. The most expensive Cyclicals are Consumer Discretionary and Industrials, selling at 16% and 11% premiums. However, their earnings continue to rebound at solid paces, and they are probably best positioned to benefit from the resumption of faster economic growth following the recent soft patch.


Tuesday, June 28, 2011

Fundamental Stock Market Indicator & Third Year of Presidential Cycle

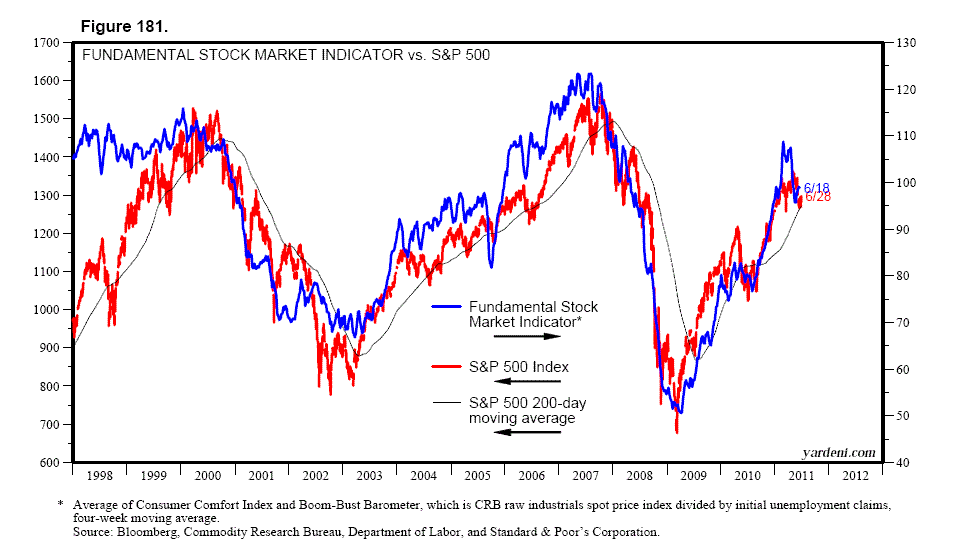
Our Fundamental Stock Market Indicator continues to meander around the recent cyclical high. It’s been doing so since initial unemployment claims rose back above 400,000 during the week of April 9 and the CRB raw industrials spot price index peaked on April 12. Jobless claims should drop back below 400,000 during July or August as the auto industry ramps up production. In addition, the pace of payroll cuts among state and local governments should slow now that they’ve cut their costs to balance their budgets for the new fiscal year that starts July 1.
 
We have been monitoring the performance of the S&P 500 this year, which is the third year of the Presidential Cycle, relative to the previous 15 comparable years of this political cycle. So far, it is most closely tracking the Harry Truman market of 1951. If it continues to do so, then the S&P 500 should be up to 1410 by the end of August and to 1465 by the end of the year. That would make it a gain of 16.5% for the year, slightly underperforming the average third-year gain of 18.3% since 1951.


Personal Consumption Expenditures


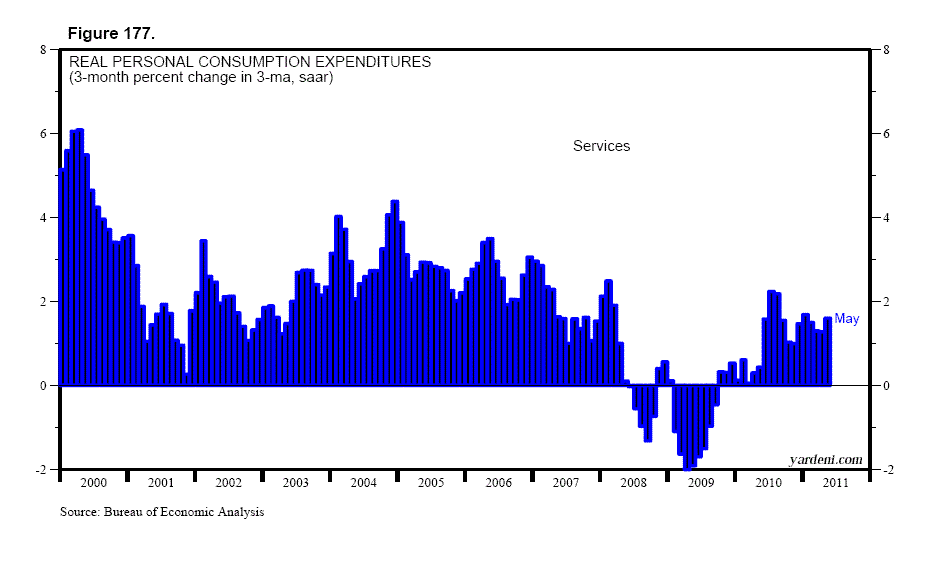
Personal consumption expenditures fell 0.1% in May following the same decline during April. On a three-month change basis, the three-month average of real consumer spending rose only 1.5% (saar) in May, down from a cyclical peak of 4.0% during December, and the slowest pace since January 2010.

 
The good news is that the recent weakness in consumer spending was mostly in durable goods consumption, especially in auto sales, and probably temporary. Over the past three months, outlays on durable goods rose just 0.8% (saar), the weakest since the start of 2010. The spike in gasoline prices during the spring certainly depressed such sales. The shortage of autos attributable to Japan’s earthquake also dampened sales. The outlook for auto sales in coming months is improving as gasoline prices fall and auto production rebounds.

Let’s not get too excited. There are a number of chronic problems that will continue to weigh on consumers for a while. The labor market remains challenging. There is plenty of deleveraging ahead. Home prices are still falling. Income inequality is widening. So while durable goods spending should rebound during the second half of the year, the pace of overall spending may remain subdued as evidenced by the lackluster growth rates over the past three months of 1.3% (saar) in real nondurable goods and 1.6% in real services, based on three-month averages.

Sunday, June 26, 2011

US Durable Goods Orders & Shipments

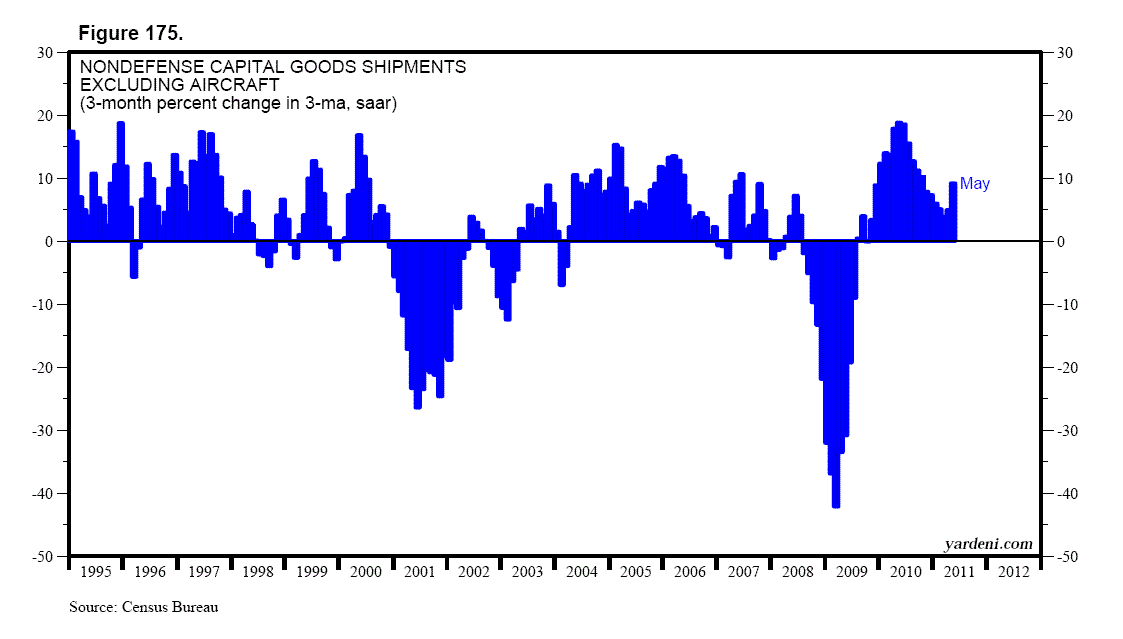
There was lots of good news in May’s durable goods orders release. Especially important is that orders for nondefense capital goods excluding civilian aircraft orders (which tend to be volatile) rose to a new cyclical high. So did shipments of this stuff. The former jumped 14.4%, and the latter rose 9.1% based on the three-month change in the three-month average at an annual rate.


These numbers suggest that capital spending could boost real GDP growth this year. That shouldn’t be a surprise given record corporate profits and cash flow, as well as record cash on corporate balance sheets, plus record low borrowing rates and the 100% depreciation allowance for 2011.

Tuesday, June 21, 2011

Crude Oil Supply & Demand

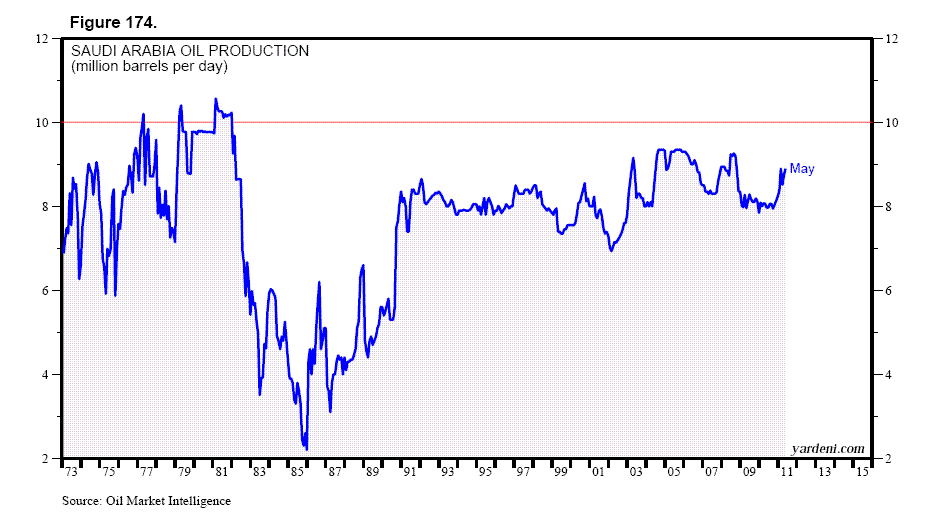
On Friday, June 10, a Saudi newspaper reported that Saudi Arabia will unilaterally raise output to 10mbd in July, from 8.8mbd in May. The report suggests that Riyadh, led by King Abdullah, is asserting its authority over fellow members of OPEC, particularly Iran, after it failed to convince the 12-member cartel to lift output. We have production data starting during 1973 for Saudi Arabia. The Kingdom’s output hasn’t exceeded 9.5mbd since February 1982. So if the Saudis actually do pump 10mbd, that will prove that they actually do have excess capacity and that they are willing to use it to keep a lid on oil prices.

 
World oil demand rose to a record 88.9mbd over the past 12 months through May. Pacing the advance was demand in the “New World” countries, which rose to a record 50.8mbd. China’s demand for crude oil rose to a new record high of 9.6mbd over the past 12 months through May. Lagging behind was the demand of the “Old World” countries, i.e., the US, Western Europe, and Japan. Their usage was 38.1mbd, still well below their record peak of 41.9mbd during August 2005.
 

Japan’s crude oil demand was especially weak following the recent earthquake and tsunami. The latest data also show some “demand destruction” in the US and in Europe.