Thursday, May 26, 2011

Social Welfare in America


Over the 12 months through April, Social Security and Medicare outlays totaled $721.1 billion and $462.1 billion, respectively. They are up 203.7% and 415.3% since January 1990. They are both well outpacing the CPI, which rose 76.0% over this period. In April, the civilian noninstitutional population 65 years old or older total 39.5 million. So spending per senior citizen on Social Security and Medicare averaged $18,265 and $11,704 over the 12 months through April. These two are up 123.5% and 279.4% since the start of 1990s, also well outpacing inflation.


Total spending on Social Security and Medicare was $1.2 trillion over the latest 12 months. That’s up 261.7% from the start of 1990. Total spending on these two programs per senior citizen was $29,969 over the past year, a 166% increase from $11,256 at the start of 1990. How many other Americans have seen their incomes nearly triple over the past two decades? Not too many. By the way, the number of seniors is projected to more than double to 88.5 million by 2050 as the Baby Boomers age and live longer. (We update these charts for subscribers to your service in our
Social Welfare in America briefing book.)

Wednesday, May 25, 2011

Bank Stocks & Bond Yields

This “peacock” chart shows the performance of the banking industries in the Financials sector since August 27, 2010, the day before Fed Chairman Ben Bernanke first talked about another round of quantitative easing. Over this period, the S&P 500 is up 23.6%, while the Financials sector is up only 12.7%, ranking as the second worst of the 10 sectors. The banking industries have all underperformed: Diversified Banks (15.0%), Investment Banking (0.6%), Other Diversified Financial Services (4.4%), Regional Banks (13.3%), and Thrifts & Mortgage Finance (-11.0%).

The banks are good for something. The S&P 500 Bank Stock Index (BSI) has been highly correlated with the 10-year Treasury bond yield since 2008. The decline in the yield from a recent high of 3.59% to 3.11% this morning coincided with weakness in the BSI. The yield isn’t likely to move higher until the BSI starts doing so.

Tuesday, May 24, 2011

Copper vs Stock Prices in US & China

The price of a pound of copper has been hovering around $4.00, after peaking at a record $4.62 on February 14. Both the S&P 500 and the Shanghai-Shenzhen 300 Composite have been highly correlated with the price of copper over the past few years.

However, US stocks are up 4.7% ytd, while Chinese ones are down 1.2% over the same period. Professor Copper suggests that for now there may not be much more upside in the US nor much more downside in China.


Monday, May 23, 2011

Europe's Credit Bubble

International banks held a record $30.4 trillion in claims on all countries during Q1-2008. That was an increase of $16.6 trillion, or 120.3%, since the start of 2005. Loans to Europeans (mostly from European banks) increased $8.4 trillion over this period to a record $15.7 trillion. Since the early 2008 peak, all loans to all countries and to European ones are down $5.3 trillion and $4.1 trillion, respectively, through the end of last year. My hunch is that much of that represents write-offs.

The lending frenzy by international banks was especially intense in the PIIGS during Europe’s Credit Bubble of the past decade. Foreign claims of banks on these five countries soared $2.2 trillion from $1.7 trillion during Q1-2005 to a record $3.9 trillion during Q1-2008. That total was down to $2.4 trillion at the end of last year.

Here’s the punch line: Europe’s Credit Bubble may be as big or even bigger than America’s Mortgage Bubble. At the start of 2005, they were both around $8 trillion. By the first quarter of 2008, they both peaked, with the European total at a record $15.7 trillion and the American total at a record $10.6 trillion. Since then, loans held by international banks to all European countries were down to $11.5 trillion at the end of last year. US mortgage credit outstanding was down to $10.1 trillion.

Thursday, May 19, 2011

S&P 500 Sectors Relative Valuation

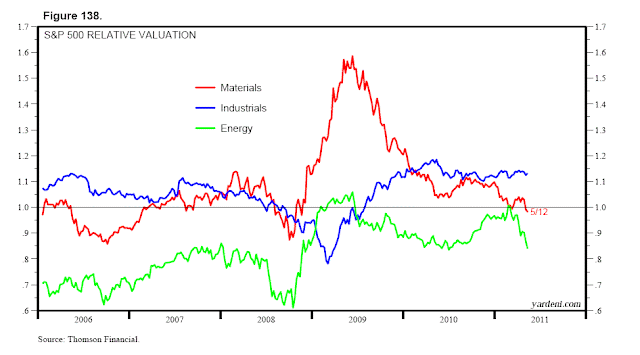
During the first two weeks of May, investors decided to take less risk and switched off the risk on/off switch. The forward P/E of the S&P 500 declined from 13.2 during the last week of April to 12.8 during the May 12 week. Relative to the market’s multiple, there have been some big swings in the valuation multiples of the various sectors of the S&P 500 in recent weeks. The biggest losers have been Energy with a drop from 1.01 to 0.84 over the past 12 weeks and Materials with a decline from 1.04 to 0.98 over the past 13 weeks.

The big winners are Consumer Staples (from 1.04 to 1.14 over the past 13 weeks), Health Care (from 0.84 to 0.95 over the past 12 weeks), Telecommunication Services (from 1.16 to 1.29 over the past 17 weeks), and Utilities (from 0.94 to 1.06 over the past 13 weeks).

Ticking slightly higher recently have been Consumer Discretionary and Information Technology. Edging lower has been Financials.

Wednesday, May 18, 2011

Global Auto Production

Global auto production has been particularly hard hit by the shortage of parts following the devastating earthquake in Japan. The global economy may spin its wheels in a soft patch until the shortage of parts is over. Japanese automakers were especially hard hit, as their output crashed 55% from 9.3 million units (saar) during February to 4.1 million units during March. That’s the lowest level since December 1968. The shortage of Japanese parts also hit US automakers hard in April, when their output decreased 12.5% to 7.9 million units, at an annual rate.


German auto output dropped 2.0% m/m to 5.6 million units in April. March data show that auto output fell 18.1% m/m in Brazil to 3.6 million units, 15.7% in France to 1.6 million units, and 13.8% in Italy to 0.6 million units. On the other hand, UK auto output rose to a cyclical high of 1.4 million units during the month.

Chinese industrial production slipped 0.6% m/m during April. It had averaged gains of 1.6% during the first three months of the year. Chinese car production fell 16.0% during the month to 18.4 million units (saar) from 21.9 million units during March.

Tuesday, May 17, 2011

US Inflation Indicators

China has been a major source of deflation in recent years. It may now be a source of inflationary pressures. That’s because wages are rising more rapidly in China. Indeed, minimum wages for millions of workers were raised by 14% to 20% at the beginning of the year. The Chinese are also allowing their currency to appreciate. The yuan is up 4.7% since September 1. No wonder then that the prices of goods imported from China into the United States rose 2.8% y/y during April. That’s the highest since December 2008. These prices were falling in 2009 and mostly flat in 2010. Prices of goods imported from the so-called Asian NICs (Hong Kong, Singapore, South Korea, and Taiwan) were up 5.8% y/y in April, matching the previous record high during 2008.


Adding to inflationary pressures in the US is the rapid depletion in the supply of new cars caused by the shortage of parts made in Japan. This boosted the CPI index for new and used cars in April by 0.8% m/m, and 2.2% y/y. The three-month percent change is up 8.5% (saar), the highest since December 2009..  

And what about rent inflation in the CPI? The concern is that falling home prices might boost tenant rent inflation as more people decide to rent rather than own their homes. In April, the three-month percent change of the CPI tenant rent index was up 1.7% (saar), based on a three-month average, about the same as recent readings this year. However, early last year these costs were falling.

Monday, May 16, 2011

Bank Stocks vs. Defensive Stocks


Over the past year, the resilience of the global bull market in stocks has been impressive in the face of the lackluster performance of bank stocks in the US, Europe, and Japan. They may continue to underperform and could be bigger drags on stock markets around the world. In the US, banks are struggling with lots of toxic mortgage assets as home prices continue to fall. In Europe, the banks are exposed to the dodgy government bonds of the debt-challenged EU members. Japanese banks are under pressure to relax their terms on loans to borrowers who have been hard hit by the earthquake and nuclear disasters.

The mounting aversion to risk isn’t likely to trigger a bear market in stocks if investors continue to rotate into defensive sectors in the stock market. Health Care stocks have gone vertical over the past two weeks. So have Consumer Staples.


Utilities and Telecommunication Services have also been outperforming recently.

Wednesday, May 11, 2011

US Petroleum Inventories

On Wednesday, the price of a barrel of WTI crude oil fell below $100 in New York and gasoline tumbled 25.69 cents, the most in more than two years, after an Energy Department report showed that US petroleum inventories were up more than expected. Crude dropped 5.5% after the department said stockpiles jumped 3.78 million barrels to 370.3 million last week. US crude oil inventories are the highest since the week of May 8, 2009, when the price of a barrel was $58.63.


Last week, gasoline inventories unexpectedly increased 1.28 million barrels to 205.8 million, the first gain in 12 weeks. Gasoline inventories are the highest since the week of May 8, 2009, when the pump price of a gallon of gasoline was $2.195. Total fuel consumption declined 0.9% to 18.2 million barrels a day, the lowest level since June 2009.

Relative Valuations

Health Care is cheap. This sector has been trading at an unusual discount ever since ObamaCare was put on the table starting in late 2008 during the presidential campaign. Information Technology is selling at 1.0 times the market’s multiple. That’s the cheapest it has been relative to the market since early 1996. However, it could remain this cheap for quite a while. Financials are at a discount, but they are not cheap considering that they’ve typically traded at deeper discounts in the past. That’s because they tend to blow up during financial crises that they cause on a regular basis.

Among the MEI sectors, Industrials are relatively expensive selling at 1.1 times the market multiple. That probably reflects a growth premium given that this sector is a major beneficiary of the global economic boom. After spiking during 2009 and 2010, Materials is trading at the market’s multiple now as forward earnings have caught up with the sector’s stock prices. Energy is trading at a slight discount. Its relative P/E has been quite volatile, but has tended to trade at deeper discounts than currently.
 
Telecommunication Services is trading at a relatively high 28% premium to the market. History suggests it is likely to revert towards the market’s multiple. Consumer Staples is at an 11% premium to the market, but it has traded at higher premiums in the past. Utilities are trading at the same multiple as the market currently.


Tuesday, May 10, 2011

S&P 500 Consensus Earnings

The 2011 S&P 500 earnings estimate has risen 3.9% since the end of last year from $95.97 to $99.69 last week. The Q1 earnings surprise has added $1.16 over the past five weeks to the 2011 estimate. The estimates for Q2-Q4 have all been rising too, and have added $1.05 to the 2011 estimate since the start of the Q1 earnings season.
 
It really is déjà vu all over again with a significant difference. When actual results beat expected ones over the past eight quarters (Figures 119 & 120), industry analysts didn’t raise their subsequent quarterly numbers as they’ve been doing during the current earnings season (Figure 121). In other words, industry analysts seem to be more optimistic about the future as a result of the latest earnings season than they were during the previous eight seasons of better-than-expected earnings. Industry analysts are aiming high.

The latest round of positive earnings surprises started during the first quarter of 2009.


Monday, May 9, 2011

Employment & Profits

The bottom line is that employers are hiring at a faster pace because their bottom lines continue to rebound. Profitable companies always expand by hiring more workers and by increasing their capacity. During the first four months of this year, payroll employment is up 768,000. Excluding government payrolls, it is up 854,000.


During economic expansions, revisions to payroll employment data tend to be to the upside. Over the past nine months, these revisions have added 346,000 to the first-reported estimates. (We update this chart for subscribers to our service in our Employment briefing book.)


Thursday, May 5, 2011

Employment Indicators

The latest batch of US economic indicators is mixed. On the weak side was yesterday’s US non-manufacturing Purchasing Managers Index (NM-PMI). It dropped 4.5 points in April to 52.8 from 57.3 in March. That is the biggest one-month drop since November 2008. It is down 6.9 points from February’s cyclical high. Interestingly, auto sales also rose to a cyclical high of 13.4 million units during February and edged down to 13.1 million units in April, as we noted yesterday.

The weakness in the NM-PMI was led by a sharp drop in the new orders index and a further decline in the employment index. The former plunged 11.4 points to 52.7, the lowest since August 2009. The latter dropped 1.8 points to 51.9, the lowest since September 2010. This jibes with the recent increase in initial unemployment claims to over 400,000 for the past three weeks. It’s possible that the jobless claims data were boosted in some way by the spring holiday season. Today’s data for the week of April 30 should shed some light on whether this important weekly indicator of the labor market is flashing orange, or is back to green.


On the positive side, the employment index in the manufacturing PMI (M-PMI) was 62.7 during April. That is down only slightly from February’s cyclical high of 64.5. Also the latest Challenger Report shows that large job cuts edged down to 36,490 during April, near recent and past cyclical lows. This series tends to be positively correlated with jobless claims, though covers a smaller subset of the labor market. Also on the positive side is the latest ADP private payroll report showing an increase of 179,000 during April. That was a bit below expectations, but still a solid increase. The really good news this morning is that the Monster Employment Index jumped to 145 during April, the highest reading since October 2008. It is up 23 points over the past three months. The strength is widespread, with good gains in manufacturing, distribution, and transportation.


Wednesday, May 4, 2011

Stock Market Fundamentals & Technicals

Our Fundamental Stock Market Indicator (FSMI) has stalled recently around cycle highs. The FSMI fell 2.6% during the week ending April 23 after rising three of the prior four weeks, for a total gain of 2.9%. That followed a three-week decline of 4.0%. It’s within 3.7% of its cyclical high posted during the final week of February.


The Bull/Bear Ratio compiled by Investors Intelligence jumped back up to 3.33 from 2.94 last week and 2.82 two weeks ago. Bullish sentiment edged up for the second straight week to 54.9%. Bearish sentiment fell for the second straight week from 19.2% to 16.5%. (We update these charts for subscribers to our service in our Stock Market Sentiment Indicators briefing book.)

Tuesday, May 3, 2011

Rent Inflation

Tenant and owners’ equivalent rents account for 39.9% of the core CPI and 17.1% of the core PCED. (Tenant rent accounts for 7.7% and 3.9% of the core CPI and core PCED. Owners’ equivalent rent accounts for 32.2% and 13.1% of the core CPI and core PCED.) The risk is that tenant rent could rise rapidly as more Americans decide to rent rather than buy their homes. That could also boost OER, since it is based on actual rents.

The problem stems from a mismatch of supply and demand of affordable rental housing in the wake of the housing crash. The foreclosure crisis has sparked a substantial increase in the number of former owners who now need to rent just at a time when development of new affordable housing units has stalled. Many potential homebuyers may postpone purchasing a house because prices are still falling. They are more likely to rent. The population of seniors is starting to increase at a faster pace as the Baby Boomers age. Seniors tend to rent rather than to own their homes when they retire as they need less space and move from houses to apartments.


On the other hand, many Americans are likely to postpone retiring. More importantly, tenant rent inflation is highly correlated with wage inflation, which is likely to remain subdued. The index of average hourly earnings was up only 1.9% y/y during April. That’s the lowest since March 2004. Tenant rent and OER are up 1.2% and 0.8% y/y through March. That’s not much. (We update these charts for subscribers to our service in our Rent Inflation Economics Alert.)

Monday, May 2, 2011

Personal Income: Earned & Borrowed

My outlook for real GDP over the rest of this year is relatively bullish for stocks. Indeed, I’m still predicting “1500 for the 500” by the end of the year. Bears looking for something to worry about can find plenty in the latest personal income report. Wages and salaries accounted for only 50.4% of personal income during March, the lowest on record.

The gap between government social welfare spending and payroll taxes earmarked to pay for such spending widened to a record $906.3 billion (saar) during March. In other words, US economic growth is increasingly based more on government borrowing to prop up social welfare income and less on earned income. (We update these charts for subscribers to our service in our Social Welfare in America briefing book.)