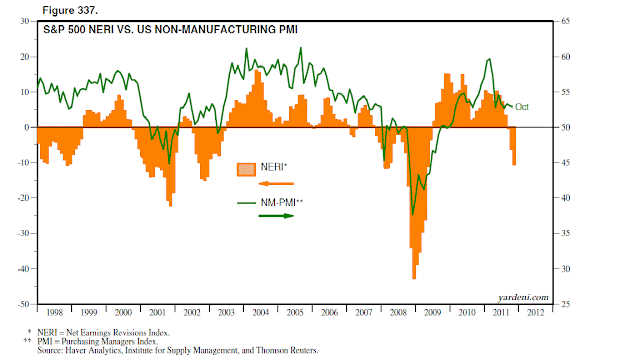
I don’t like what I am seeing in the S&P 500’s Net Earnings Revisions Indexes (NERIs). They are calculated as the number of estimates revised up less the number that have been revised down, expressed as a percentage of the total estimates for the month. To smooth out the high degree of m/m volatility, I track three-month rolling averages. A NERI reading of 100% indicates that all of the estimates are rising, -100% means all estimates are falling, and zero means that an equal percentage of estimates are rising and falling. Here’s what’s worrisome:
(1) The S&P 500’s NERI dropped to -10.5% in November, down from -6.0% in October. It is now the lowest since May 2009. This is another indicator showing that despite the very strong Q3 earnings results reported during October, industry analysts are lowering their expectations. They may be getting guidance from company managements that Europe is a problem. Or, they may be simply reading the financial press and plugging the bad news coming out of Europe into their spreadsheets.
(2) The S&P 500’s NERI is highly correlated with both the manufacturing PMI and the non-manufacturing PMI. The M-PMI has been hovering just north of 50 from July through October, having peaked this year at 61.4 during February. In the past, whenever NERI turned negative, the M-PMI had a tendency to fall below 50. The good news is that the correlation between NERI and the NM-PMI isn’t as tight, or as alarming.
(3) NERI was negative for all 10 sectors during November versus 8/10 sectors during October. The worst was Telecom (-24.2%) followed by Financials (-23.2), Materials (-17.7), Energy (-15.1), Industrials (-13.3), Information Technology (-8.8), Consumer Staples (-5.8), Consumer Discretionary (-2.9), Utilities (-2.7), and Health Care (-1.6). |


No comments:
Post a Comment