Wednesday, November 30, 2011

US Home Sales & Prices

The housing industry remains in a depression. The sum of existing and new single-family home sales bottomed last year at 4.1 million units (saar). This year, it has been fluctuating around 5.3 million units. That’s down from a record high of 8.5 million units during July 2005. It matches the pace of sales during the mid-1990s, just before the housing bubble.

Housing activity is likely to remain depressed next year. Despite record low mortgage interest rates, the mortgage applications index for purchasing homes remains around the lowest readings since the mid-1990s. High unemployment and tougher lending standards are offsetting record low mortgage rates.

In addition, home prices are still falling, which must be another reason why home sales remain weak. There’s no rush to buy if home prices are either moving sideways or down. There are four major measures of home prices. The most current one is the median existing home price compiled by the National Association of Realtors. It is available through October. It is very volatile on a m/m basis, so Debbie and I track the 12-month moving average, which dropped to a new cyclical low of $166,108 during October. That’s 25.9% below the record high of $224,283 during July 2006, and the lowest since November 2002.

Tuesday, November 29, 2011

US National Income Shares


(1) National Income (NI) is growing slowly. During Q3, NI totaled a record $13.4 trillion (saar), up only 3.8% y/y. That’s down from a recent peak of 6.7% during Q3-2010, and the slowest since Q4-2009. Over the past four quarters, compensation rose just 2.8% while profits rose 7.9%. This divergence suggests that profits have been gaining share of NI at the expense of labor. However, it also reflects the fact that compensation is tied to domestic growth, which has been subpar in the US, while profits have been getting a boost from faster global economic growth.


(2) The rebound in profits’ share of National Income has been spectacular. It jumped from a recession low of 7.9% during Q4-2008 to 14.7% during the third quarter of this year. That surpasses all previous cyclical peaks.

(3) After-tax comparisons show even more remarkable results for profits. NI share comparisons only make sense on a strictly pre-tax basis. But let’s do them on an after-tax basis to glean some insights on how our taxation and social welfare systems redistribute income. After-tax corporate profits rose to a record high 11.6% of NI during Q3, far surpassing any previous peak.

(4) Compensation of employees continued to lose share of National Income during Q3. It fell to 61.4%, the lowest since Q3-1965, and down from a record high of 68.5% during Q2-1980. It may be returning to the 58%-60% “norm” of the late 1940s. This round trip coincides with the rise and fall of the membership and power of private sector unions in the United States. The picture looks much worse for compensation from wages and salaries (excluding benefits). This share fell to a record low of 49.4% of NI during Q3. It has been on a downtrend since the late 1960s, when the norm had been around 57% following the end of World War II.

(5) Workers have opted for a larger share of their compensation in benefits. These benefits tend to be dominated by health care benefits, which are provided on a tax-free basis. As a result, the share of compensation paid as “supplements to wages and salaries” rose from about 3% in the late 1940s to about 12% in the early 1980s. This NI share has continued to fluctuate around this level since then. It was 12.0% during Q3.

(6) Personal income both before and after taxes remains very high relative to National Income. Notwithstanding the dismal downward trends of the NI shares of pre-tax compensation measures, personal income was 96.6% of NI during Q3, which is where it has been since the mid-1980s. Disposable personal income was 86.1% of NI during Q3, which is down only slightly from the recent record high of 89.9% during Q2-2009.

How can this be? What’s propping up pre-tax and after-tax personal income to offset the downward pressure on compensation measures relative to National Income? Government social benefits paid to individuals have soared from less than 4% of NI during the early 1950s to over 17% recently. Such benefits were mostly covered by payroll taxes collected from employers and employees until 2001.

This pay-as-you-go system has been derailed since then as the deficit between entitlements and payroll tax revenues ballooned from zero at the beginning of the previous decade to nearly $900 billion over the past 12 months through October. In other words, pre-tax and after-tax personal incomes have been propped up by deficit-financed government transfers to individuals.

Sunday, November 27, 2011

European Monetary & Business Indicators

Europe is starting to fall into a recession, and it is starting to depress global economic activity. While I still believe that the global economy can grow if Europe falls into a recession, growth certainly would be slowed.

A possible fatal flaw with this decoupling thesis may be that Europe’s recession isn’t attributable just to the implementation of austerity measures to restore fiscal discipline. Increasingly, it’s looking like an old-fashioned credit crunch, as Europe’s banks are retrenching on their lending activities so that they aren’t forced to raise more capital, which is either very expensive or very scarce right now.

Europe’s Monetary Financial Institutions (MFIs) had a combined loan portfolio of €12.4 trillion during September, a record high. That’s $16.5 trillion, which well exceeds the $6.9 trillion in bank loans in the US. Facing higher capital requirements and fearing more losses on their sovereign bonds, the banks are likely to respond by reducing their lending, not only in Europe but around the world.

Of course, banks elsewhere might pick up the slack and the capital markets remain wide open to most corporate borrowers. Nevertheless, a severe credit crunch coming out of Europe could trigger a global recession. Hopefully, the latest Grand Plan to clean up the Euro Mess, which is discussed in today’s Morning Briefing (for our subscribers), is actually coming and will be effective at averting a European credit crunch. For now, the latest batch of global indicators shows that Europe is falling into a recession, while the global economy continues to grow, albeit at a slower pace. Let’s review some of these most relevant indicators:

(1) New orders dropped sharply during September in Europe. The euro area (EA17) industrial new orders index plunged by 6.4% following an increase of 1.4% during August. In the European Union (EU27), new orders decreased by 2.3% in September, after falling 0.3% in August. Excluding ships, railway & aerospace equipment orders, which tend to be more volatile, industrial new orders dropped by 4.3% in the EA17 and by 2.1% in the EU27.

(2) Capital goods orders led the drop in European orders. In September, new orders for capital goods fell by 6.8% in the euro area and by 2.1% in the EU27. Intermediate goods dropped by 3.2% and 2.1%, respectively. Nondurable consumer goods declined by 2.0% in both zones. Durable consumer goods decreased by 0.6% in the euro area, but increased by 1.1% in the EU27.

(3) The biggest losers among Europe’s manufacturers are those in the biggest economies. Among the member states of the EU for which data are available, total manufacturing orders fell in 10 and rose in 12 during September. The largest decreases were registered in Italy (-9.2%), Estonia (-9.1), France (-6.2), Spain (-5.3), and Germany (-4.4). The largest increases occurred in Denmark (14.0), Latvia (13.1), Poland (5.1), and the Czech Republic (4.8).

Tuesday, November 22, 2011

S&P 500 Net Earnings Revisions Index

I don’t like what I am seeing in the S&P 500’s Net Earnings Revisions Indexes (NERIs). They are calculated as the number of estimates revised up less the number that have been revised down, expressed as a percentage of the total estimates for the month. To smooth out the high degree of m/m volatility, I track three-month rolling averages. A NERI reading of 100% indicates that all of the estimates are rising, -100% means all estimates are falling, and zero means that an equal percentage of estimates are rising and falling. Here’s what’s worrisome:

(1) The S&P 500’s NERI dropped to -10.5% in November, down from -6.0% in October. It is now the lowest since May 2009. This is another indicator showing that despite the very strong Q3 earnings results reported during October, industry analysts are lowering their expectations. They may be getting guidance from company managements that Europe is a problem. Or, they may be simply reading the financial press and plugging the bad news coming out of Europe into their spreadsheets.

(2) The S&P 500’s NERI is highly correlated with both the manufacturing PMI and the non-manufacturing PMI. The M-PMI has been hovering just north of 50 from July through October, having peaked this year at 61.4 during February. In the past, whenever NERI turned negative, the M-PMI had a tendency to fall below 50. The good news is that the correlation between NERI and the NM-PMI isn’t as tight, or as alarming.

(3) NERI was negative for all 10 sectors during November versus 8/10 sectors during October. The worst was Telecom (-24.2%) followed by Financials (-23.2), Materials (-17.7), Energy (-15.1), Industrials (-13.3), Information Technology (-8.8), Consumer Staples (-5.8), Consumer Discretionary (-2.9), Utilities (-2.7), and Health Care (-1.6).

Monday, November 21, 2011

Credit Insurance Fraud Industry

Who is to blame for this mess? I’ve accused the Credit Insurance Fraud Industry (CIFI) of causing the financial crisis that started in the US subprime mortgage market during 2007 and has now spread to the European sovereign debt market. This industry expanded dramatically during the previous two decades by selling credit insurance derivative products that magically transformed subprime mortgages, junk bonds, liars’ loans, and other trashy debts into AAA-rated credits. This financial engineering was a great business while it lasted. But it was all mostly a huge fraud.

In the June 9, 2009 Morning Briefing, I wrote: “Before the crisis started in 2007, the fastest growing business was the Credit Insurance Fraud Industry. This industry emerged following the Basel Accords of 1988. The banking regulators of the major industrial nations agreed to impose uniform capital requirements on banks. Risky assets required more capital. The credit insurance fraud industry employed an army of financial engineers whose innovations magically transformed the most dodgy loans and bonds into AAA securities. Many of these products were defective. Fraud was rampant in the industry. The worst offenders were the credit rating agencies that had awarded triple-A ratings to thousands of CDOs.”

Lloyd Blankfein, the chief executive of Goldman Sachs, wrote an article in the February 8, 2009 FT titled, "Do not destroy the essential catalyst of risk." He observed that it should have been obvious that there was something not right about CDOs: “In January 2008, there were 12 triple A-rated companies in the world. At the same time, there were 64,000 structured finance instruments, such as collateralised debt obligations, rated triple A. It is easy and appropriate to blame the rating agencies for lapses in their credit judgments. But the blame for the result is not theirs alone. Every financial institution that participated in the process has to accept its share of the responsibility.” Mr. Blankfein, who is still the CIFI’s capo di tutti capi, should be asked the following three questions under oath: “When did you know this? Why didn’t you alert us sooner? How much money did your firm make selling these bogus instruments to your customers while shorting them at the same time?”

The CIFI’s financial alchemy can create the illusion that trash has been turned into gold, but it’s all hocus pocus; it’s not real. We all know how the CIFI messed up the US mortgage market. Let’s consider its major contributions to the Euro Mess:

(1) The euro transformed Greek debt into German debt. Prior to the introduction of the euro on January 1, 1999, bond buyers required higher yields on European bonds issued by “weak” credits such as the government bonds of Greece, Italy, and Spain versus the much lower yields on German bonds. Indeed, during 1992-1994, the Greek yield was over 20%. It plunged below 4% in June 2003, matching the German yield. The government bond yields of all the other members of the euro zone also converged to equal the German yield.

The euro had converted the junk debt of some of the members into AAA credits. But not for long, given that now the Greek yield is 25%. That yield soared after a new Greek government revealed in late 2009 that the previous one had fraudulently understated the size of its fiscal deficit. In other words, governments can be involved in the CIFI.

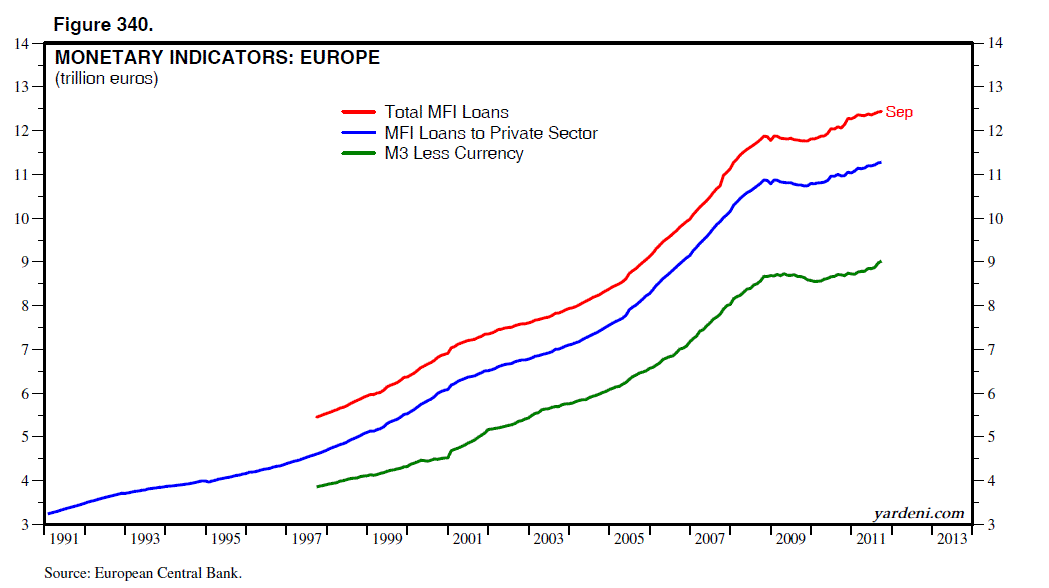
The Bond Vigilantes became much less vigilant and stopped doing their due diligence on the credit quality of what are now called the “peripheral” countries of the euro zone. So, the buyers of the bonds willingly bought into the fraud and enabled the CIFI to expand like mad. Besides, is it really necessary to do any credit research at all on any bond if you can protect against its default by purchasing the CIFI’s insurance policies against such “credit events?” The answer to this question should have been, “Yes, it is!”--especially after AIG blew up. Instead, European banks loaded up on euro-denominated sovereign debt as though it was all issued by Germany.

(2) The Euro Mess may be morphing into AIG-2.0. The October 16, 2008 issue of BusinessWeek had a very good analysis of how AIG brought down the European banks: "How AIG'S Credit Loophole Squeezed Europe's Banks." Before the financial crisis hit, AIG did a booming business in credit default swaps. The biggest buyers were European banks, whose deals during 2007 with AIG totaled a staggering $426 billion. “But the banks didn’t always buy the swaps as insurance against defaults--they often used them to skirt capital requirements… By owning credit default swaps, banks could make it appear as if they had off-loaded most of the risk of a loan to AIG or another firm, thereby reducing their capital needs. The perfectly legal ploy allowed banks across the Continent to free up money to make more loans. It was part of the game taking place across the global financial system. During the boom, firms seemingly created money out of nothing, propelling the markets to unsustainable heights. Such excessive risk-taking has brought down several European lenders.” The European banks had set aside only 1.6% of a loan's value, rather than 8%. When AIG imploded on September 15, 2008, European banks suddenly found themselves up the creek without a paddle. That’s where they are again now.

European leaders have fashioned three Grand Plans (GP) so far. All three seem to have turned their sovereign debt problem into a full-blown banking crisis. The first Greek rescue plan (GP-1.0) was approved on May 9, 2010 and established the EFSF. By July 21 of this year, a second rescue plan (GP-2.0) was needed. It included voluntary haircuts of 20% and increased the size of the EFSF. In the third plan (GP-3.0) on October 27, lenders were forced to accept a voluntary 50% haircut on their Greek debt. The latest plan is shaping up to be AIG-2.0 because banks holding European sovereign debt can no longer be sure that the CDS contracts they purchased to insure against defaults will be honored. So, they’ve been selling their bonds. In principle, the EFSF was expanded again under GP-3.0 to buy these bonds, but the details remain in limbo.

(3) The EFSF is a CDO-Squared. On Friday, ECB President Mario Draghi hit back at the European leaders who have recently called on the ECB to clean up the Euro Mess for them. Instead, he insisted that they implement their bailout fund: “We are more than one and a half years after the summit that launched the EFSF as part of a financial support package amounting to 750 billion euros or one trillion dollars; we are four months after the summit that decided to make the full EFSF guarantee volume available; and we are four weeks after the summit that agreed on leveraging of the resources by a factor of up to four or five and that declared the EFSF would be fully operational and that all its tools will be used in an effective way to ensure financial stability in the euro area. Where is the implementation of these long-standing decisions?,” he demanded to know in a speech at the European Banking Congress, "Continuity, consistency and credibility," European Central Bank (November 18, 2011).

The EFSF has slammed into a brick wall because it is based on the faulty premise that Europe’s non-AAA debtors can join together with the AAA-rated ones to form a triple-A-rated rescue fund that can borrow on behalf of the debtors who need to be rescued. That sure sounds like the super-senior tranche of a CDO. The assumption is that the fund will remain AAA-rated even if it is expanded. That assumption held up after the EFSF was increased to €440 billion on July 21, but the non-AAA guarantors of the fund (i.e., Italy and Spain) were downgraded because they thus became exposed to more liability. When the EFSF was expanded in principle again on October 27 to over €1 trillion--in effect, a CDO-Squared--the details of how this would be done were omitted to avoid a downgrade of France’s AAA rating, which would have forced the rating agencies to lower the credit rating of the EFSF.

Note: This is an excerpt from today’s Morning Briefing for our subscribers.

Thursday, November 17, 2011

US Production & Railcar Traffic

Despite the worsening financial turmoil in Europe, US industrial production rose once again to a new cyclical high during October. Manufacturing output rose for the fourth consecutive month. It is up 4.1% y/y and 4.4% (saar) on average over the past three months compared to the previous three months. Production of business equipment has been especially strong, with information processing at a new record high and output of industrial goods at a cyclical high. Motor vehicle assemblies rose to 9.3 million units (saar) during October, up from the year’s low of 7.9 million units during all three months of Q2.

Also moving along nicely in the US is railcar traffic. The 26-week average of car loads rose to a new cyclical high of 292.7 units during the week of November 5, the highest since the week of February 21, 2009. Intermodal loadings rose to a new cyclical high as well and are approaching the record high near the end of 2006. Both suggest that production remains strong, while the intermodal data also suggest that imports are strong as the holiday season approaches. Recent inventories data suggest that most of the production and imports are going to meet final demand.

Wednesday, November 16, 2011

Retail Sales

One way to revive confidence, in my opinion, is to end support payments for long-term unemployment. That should bring down the unemployment rate. Such government subsidies tend to prolong unemployment by reducing the incentive to find a job. My suspicion is that some of the recipients of such benefits are actually working for cash, and off the books.

This helps to explain why retail sales have been resilient despite high unemployment and weak payroll employment. In any event, the labor market seems to be improving, as evidenced by the four-week moving average of initial unemployment claims, which fell to 400,000 during the week of November 5. That was the lowest reading since the week of April 16. Let’s review that latest data on retail sales:

(1) Retail sales rose 7.2% y/y to a new record high of $4.77 trillion (saar) during October. That puts it 5.1% above the previous cyclical (and record) peak during November 2007. That’s quite impressive considering that sales of motor vehicles and parts are still 12.1% below their 2007 peak.

(2) Also at new record highs during October are the following retail sales categories: Sporting Goods, Hobby, Book & Music Stores ($92bn); Pharmacies & Drug Stores ($231bn); General Merchandise Stores ($637bn); Warehouse Clubs & Super Stores ($396bn in September); Food & Beverage Stores ($627bn); Nonstore Retailers ($403bn including Electronic Shopping & Mail Order Houses); and Miscellaneous Retailers ($124bn).

(3) Industry analysts have been raising their 2012 earnings expectations for the major Retailers since the beginning of this year. The biggest upward revision has been in Department Stores with an increase of 19.5% in the earnings estimate (ytd through the week of November 3). Also up big over this period are Apparel Retail (13.9), Home Improvement Retail (12.3), and Hypermarkets & Super Centers (7.9). The consensus 2012 earnings estimate for General Merchandise Stores has been flat so far this year, while Computer & Electronic Stores is down 3.1%.

By the way, Paul Krugman doesn’t agree with me now, but he did only a couple of years ago. On March 4, 2010, he wrote that it is “bizarre” to worry that unemployment benefits reduce people’s incentives to find jobs. Here’s what he wrote with his coauthor (and wife) on page 210 of their textbook Macroeconomics (2nd ed.), published in 2009: “Public policy designed to help workers who lose their jobs can lead to structural unemployment as an unintended side effect. . . . In other countries, particularly in Europe, benefits are more generous and last longer. The drawback to this generosity is that it reduces a worker’s incentive to quickly find a new job. Generous unemployment benefits in some European countries are widely believed to be one of the main causes of ‘Eurosclerosis,’ the persistent high unemployment that affects a number of European countries.”

Add caption

Tuesday, November 15, 2011

S&P 500 Financials

Financials now account for only 13.5% of the market capitalization of the S&P 500, down from a recent peak of 16.9% during April 2010 and a record high of 22.2% during January 2007. In other words, the sector has less weight in the S&P 500 than in the past to drag down the overall index. Besides, banks aren’t as important to the economy now as in the past, when they provided much more credit to the economy. They certainly have cut back on their mortgage lending. Their commercial and industrial loans are expanding, but at a slow pace driven by the cautious rebuilding of inventories by businesses. Most importantly, the capital markets have displaced a lot of bank lending.

Financials accounted for 25%-30% of the S&P 500 earnings during their heydays of the previous decade before they imploded in 2008. That share plunged to a low of 11.5% during February 2009. It then rebounded to 17.6% during December 2010, and was back down to 16.2% during October, and probably going lower.

With one exception, analysts have been reducing their 2012 forecasts for the major banking industries in the S&P 500 Financials sector all this year. For the overall sector, their 2012 estimate has been cut by 14.8% ytd through the first week of November. This decline has been led by a 33.2% plunge in the consensus estimate for Investment Banking & Brokerage (ETFC, GS, MS, SCHW). Other Diversified Financial Services (BAC, C, JPM) and Diversified Banks (CMA, USB, WFC) have seen estimates cut by 26.2% and 8.0% so far this year. Regional Banks have been lowered by 5.6%. The exception is Consumer Finance (estimates up 16.0%).

Monday, November 14, 2011

Chinese Money & Credit Indicators

Recently, Chinese Premier Wen Jiabao said that economic policies may be “fine-tuned” and pledged support for smaller companies that have been hard hit by a credit crunch as monetary policy was tightened to fight rising inflation. The CPI peaked this year at 6.5% y/y during July and fell to 5.5% during October. Wen’s fine-tuning announcement suggests that the balance of risks had shifted from inflation to growth.

The central bank may cut reserve requirements for smaller lenders to free up credit for small companies hit hardest by a credit squeeze. The People's Bank of China raised banks' reserve requirement ratios nine times from November to June to a record 21.5% for the biggest lenders. The rate for smaller lenders is 19.5%. That tightening along with interest rate hikes significantly slowed the growth in M1 (measured in yuan) from a peak of 38.4% y/y during January to 9.2% during October. Yuan-based M2 growth slowed from 29.7% during November 2009 to 12.9% during October. However, bank lending was 586.8 billion yuan ($92.5 billion) during the month, the most since June, exceeding the previous month's 470.0 billion yuan. In China, the government guides lending levels.

On the other hand, Chinese officials have stressed recently that they are not prepared to ease up on property restrictions that are depressing that market. A week ago, Premier Wen said in a television broadcast, “There won’t be the slightest wavering in property-tightening measures; our target is for prices to return to reasonable levels.” How bad is it? In Wenzhou, where house prices have dropped sharply, a real estate developer is giving away BMWs with each apartment that is purchased to the first 150 buyers.

House prices have started to fall nationwide. This is coming as a shock to many Chinese who assumed that prices would continue to rise. Sound familiar? The difference is that in China, homebuyers actually are required to put up large down payments when they take out a mortgage.


Thursday, November 10, 2011

European Interest Rates

Has there ever been a margin call on the debt of the government of a major industrial economy before? I don’t think so, but there was one yesterday on the Italian government’s debt. On Wednesday, clearing house LCH.Clearnet SA raised initial margin requirements on Italian bonds across a range of maturities. The margin on bonds due between 7-10 years was raised by 5 percentage points to 11.65%, for bonds due between 10-15 years it was raised by 5 percentage points to 11.80%, and for bonds that mature in 15-30 years the margin was raised by 5 percentage points to 20%.

The yield on the benchmark 10-year Italian government bond soared above 7%, the level that prompted Greece, Ireland, and Portugal to seek bailouts from the EU. Just as alarming, shorter-dated yields rose at an even faster clip, with the two-year yield climbing nearly a full percentage point to 7.11%. The yield on Treasury bills due in a year's time breached 6%. That’s not a good sign ahead of Italy's €5 billion auction today.

The selloff occurred despite news that Italian Prime Minister Silvio Berlusconi may step down. Under Berlusconi, Italy’s public debt soared above a record $2.6 trillion, or about 120% of GDP, the second largest imbalance in Europe after Greece. This happened as the government financed Italy’s bloated social welfare state with more and more government bonds. Bond investors weren’t very vigilant and willingly purchased these bonds at slight premiums to German bonds, especially after the formation of the euro zone. Obviously, my old friends the Bond Vigilantes have been stirred and are now attacking Italy just as the barbarians invaded the Roman Empire many centuries ago.

What incited them to riot now? Ironically, it was the third Grand Plan (GP-3.0) fashioned by European leaders on October 27 to rescue Greece and shore up confidence in the euro by bolstering the EFSF rescue fund. GP-1.0 was the first rescue plan for Greece, which was implemented during May 2010. GP-2.0 was the second plan approved by EU leaders on July 21, which included a voluntary 20% haircut on Greek debt. GP-3.0 will go down in history as a case study in unintended consequences:

(1) Cancelling insurance policies was a mistake. GP-3.0 destroyed the CDS market for European sovereign debt by forcing lenders to accept “voluntary” 50% haircuts on their Greek debt. That led to more selling of Italian bonds by investors, who had bought credit default swaps to reduce their downside risks.

(2) A plan without details is an outline, not a plan. By failing to detail just exactly how the EFSF would be levered up from €440 billion (as set by GP-2.0) to over €1.0 trillion, GP-3.0 depressed the demand for EFSF bonds, as evidenced by the bad reception for the €3 billion auction of the rescue fund’s bonds on Monday.

(3) Raising and dashing expectations doesn’t instill confidence. Raising expectations that China might help to fund the EFSF was also a big mistake, especially since these hopes were so quickly dashed after the Chinese rebuffed the European fund raisers recently.

Wednesday, November 9, 2011

Stock Market Indicators

The S&P 500 is highly correlated with our Fundamental Stock Market Indicator (FSMI). The FSMI fell for the third time in four weeks, dropping 1.1% during the final week of October and 3.2% over the four-week period to its lowest level since November 13, 2010. It’s down 17.5% since its cyclical high posted back in February.

Our FSMI is the average of the Weekly Consumer Comfort Index (WCCI) and our Boom-Bust Barometer (BBB). Here’s how they performed the week of October 29: 1) The BBB was flat during the latest week after declining nine of the prior 11 weeks for a total drop of 9.7%. It’s 17.0% below its record high (posted in March). Jobless claims--a component of our BBB--edged down to 404,500, based on 4-wa, after weekly claims sank to 397,000. The latest decline in the 4-wa is the fifth in six weeks since hitting a 9-week high of 422,250 during the week of September 17. The CRB raw industrials spot price index, another component, has currently stabilized around recent lows. 2) The WCCI fell to its lowest reading since Q1-2009, and the second lowest in the data series’ almost 26-year history.

Investors Intelligence's Bull/Bear Ratio rose for the fourth straight week to 1.27 this week from a 2½-year low of 0.74 four weeks ago. Bullish sentiment increased steadily over the four-week period to 44.2% from 34.4%, which had been the fewest bulls in more than a year. Bearish sentiment fell to 34.7% from 46.3% four weeks ago, which was the most bears since March 2009. Those calling for a correction edged up from 20.0% to 21.1% this week, just above the early October low of 19.3% (which was the first reading below 20% since September 2008).

Tuesday, November 8, 2011

US Commercial Banks

US commercial banks have lots of cash and continue to deleverage. At the end of October, banks held a record $2.5 trillion in liquid assets. They accounted for 26.6% of bank credit, which remained near the highest percentage since mid-2005. They were only 20.0% of bank assets at the end of October, because assets have been boosted by a huge increase in cash held as bank reserves over the past three years from $329.8 billion on September 10, 2008, to a record $2.0 trillion on June 29 of this year. Cash was down to a still enormous $1.7 trillion at the end of October. Combined cash and liquid assets accounted for 33.3% of total bank assets at the end of October. That’s near the record high of 35.0% 17 weeks ago.
 
 
The most remarkable development in the banking sector is that borrowing by the banks as a percentage of their liabilities has plunged from a record high of 24.5% during October 2008 to a record low of 14.1% at the end of October. Banks have taken advantage of the huge inflows into their deposits to reduce their leverage.


Monday, November 7, 2011

US Employment Indicators

Pay no attention to the first estimate of payroll employment provided monthly by the Bureau of Labor Statistics (BLS). I have been giving this advice for many years, as I’ve observed that during economic expansions the data tend to be revised higher, and lower during recessions. I’ve argued that in assessing the strength or weakness of the economy, more weight should be given to the previous two months of data and their revisions than to the first preliminary estimate of the latest month. The most recent revisions are certainly encouraging, as are several of the other labor market indicators:

(1) Revisions find more jobs. Nonfarm payrolls were revised upward by 102,000 during August and September. During the third quarter, payroll employment rose 129,700 per month on average, up from 96,700 during Q2. October’s preliminary (and unreliable) gain was 80,000. Private sector payrolls were revised up by 84,000 during August and September, and rose 145,000 per month on average during Q3, while October’s gain was 104,000.

Over the past 12 months through September, revisions added 274,000 (based on first estimates) to total payrolls, which rose 1.59 million over this period (see chart above). Private sector employment rose 1.82 million over the past 12 months through October. This jibes with the ADP survey of private sector employment, which tends to be revised much less than the BLS data, and is up 1.74 million y/y through October.

(2) The household employment survey confirms improving trend in payrolls. This survey also tends to be less prone to revisions because it is based on one-time monthly surveys of households. According to this measure, employment rose 277,000 during October, and is up 1.22 million over the past 12 months.

(3) The indexes of aggregate hours worked continue to rebound. For all workers, it edged up 0.1% during October. For production and nonsupervisory employees, it rose 0.4% during the month, with manufacturing up 0.5%. Debbie reports that the percentage of industries expanding or maintaining their payrolls rose from 56.7% in September to 60.7% in October.

(4) The Monster Employment Index of online job ads shows an encouraging uptrend. This index rose to 151 during October, the highest reading since September 2008 (see chart below). Leading the way is the transportation and warehouse industry. Not far behind is the retail industry. The indexes for both industries have rebounded back to their record highs of 2007. Lagging, but still making decent comebacks, are the manufacturing and information technology indexes. The big laggard is the index for the finance and insurance industry.

Thursday, November 3, 2011

S&P 500 Revenues and Earnings


It has been a great earnings season. It’s not over yet, but of the 388 S&P 500 companies that have reported their Q3 results, earnings are up 22.9% on a 12.7% increase in revenues. The problem is that even as companies have provided lots of positive surprises, analysts have been cutting their earnings estimates for Q4 and all four quarters of 2012. That’s because they are turning increasingly cautious on the outlook for revenues and for the profit margin:

(1) Over the past four weeks, their 2012 estimate for S&P 500 revenues dropped 1.3% from $1097.16 per share to $1082.46. They now expect revenues to increase 4.0% y/y in 2012, down from 2011’s estimated growth rate of 9.8%.

(2) For 2012, the S&P 500’s profit margin--which we calculate by dividing analysts’ consensus expectations for operating earnings by expected revenues--slid from 10.2% nine weeks ago to a new low of 9.9% during the week of October 27.

(3) Among the 10 sectors of the S&P 500, there have been significant declines in consensus 2012 earnings forecasts in recent weeks for Financials, Telecommunication Services, Energy, and Materials. The other sectors have edged down too, with the exception of Health Care and Utilities, which have been relatively stable.

Why is there such a disconnect between the latest upbeat earnings results and analysts’ downbeat revisions for the coming quarters? They must be getting downward guidance from company managements. Yesterday’s FOMC statement notes that “there are significant downside risks to the economic outlook, including strains in global financial markets.” The Fed isn’t alone in lowering expectations for economic growth next year. October’s surveys of purchasing managers showed recessionary readings for the major economies of Europe. Company managements must be seeing a worrisome deterioration in the prospects for European economies and telling analysts to curb their enthusiasm about Q4 and 2012.

Wednesday, November 2, 2011

Purchasing Managers Indexes

The global economy was able to grow and prosper during the previous two decades even though they were described as “lost decades” for Japan, the world’s second largest economy back then. The question is whether the global economy can do the same if Europe’s economy is now facing a lost decade? I think so, but right now Europe’s economy may be already in a recession that will certainly depress global economic growth. For now, most of the pain in the global economy is showing up in Europe’s economic indicators:

(1) OECD predicts a growth recession for Europe next year. On Monday, the OECD slashed its 2012 growth forecast for the euro zone to 0.3% from 2.0% in May.

(2) Unemployment rising in Europe. During September, 23.3 million people were unemployed in the 27 countries of the European Union. That includes 16.2 million unemployed in the euro zone. Compared with August 2011, the number of persons unemployed increased by 174,000 in the EU27 and by 188,000 in the euro area. As a result, the jobless rate in the euro zone rose slightly to 10.2% in September from a revised 10.1% in August.

(3) European manufacturing purchasing managers are depressed. Manufacturing purchasing managers indexes (M-PMI) were weak in all of the major European countries during October. The UK index dropped to 47.4 from 50.8. The EU index fell to 47.1, the lowest since July 2009. Germany decreased to 49.1, the first reading below 50 since September 2009. France edged up from 48.2 to 48.5, but remained under 50. Italy plunged to 43.3.

(4) US manufacturing growing, but at a slower pace. The M-PMI in the US edged down during October, but remained above 50. It was 50.8 during the month. The weakest component was the inventories index, which dropped to 46.7 from 52.0. Still on the upside were production (50.1), orders (52.4), and employment (53.5).

Tuesday, November 1, 2011

S&P 500 Earnings


There were a few tricks in Q3 earnings, but most earnings reports were a treat. So it was another great quarter for earnings. Q3 is shaping up to be the eighth quarter in a row of double- or triple-digit earnings growth. As of October 28, the actual/estimated blended growth rate was 16.3% y/y. For the 330 S&P 500 companies that reported so far, the average earnings growth rate is 24.1%.

That’s the good news. Not so good is that while Q3 is beating the consensus analysts’ expectations at the start of the earnings season for the eleventh quarter in a row, the analysts continue to lower their Q4 and 2012 estimates. They must be getting quite a bit of downbeat guidance from company managements that’s more than offsetting the upbeat Q3 surprises. Let’s review the latest earnings data:

(1) Q4 expectations continue to slide. During economic expansions, the fourth quarter tends to be the best of the four quarters for earnings. So, it’s worth noting that while Q3 earnings are beating consensus expectations for the quarter, analysts lowered their Q4 estimate for the thirteenth week in a row to slightly below the latest actual/estimated number for Q3. Q4’s growth rate is now expected to be 11.5% y/y, down from a peak estimate of 18.5% during the week of June 3 of this year.

(2) Expectations for 2012 are also on a slippery slope. The consensus for next year’s S&P 500 operating earnings fell to $108.45 at the end of October from a peak of $113.83 during the week of August 5. Joe and I expect it will fall to $100 by the end of this year, and that it will be the actual outcome in 2012.

(3) Forward earnings are starting to trace a square root. When we do our P/E x E analysis of the stock market, we use forward earnings, which is the time-weighted average of the current and coming year estimates. During 2009 and 2010, there was a V-shaped recovery in forward earnings, as we predicted. We’ve been curbing our enthusiasm for earnings in recent months. We were too cautious on Q3, which beat our expectations significantly. However, forward earnings have flattened out over the past 15 weeks. The V-shaped recovery may be turning into a square-root pattern.