Wednesday, July 20, 2011

Core Inflation Rates


The trend for core CPI inflation among the 30-member countries of the OECD is still relatively subdued. The OECD rate, excluding food and energy, moved up to 1.7% y/y in May from 1.2% at the start of the year. It was at a record low of 1.1% in September and October of last year. It peaked at 2.4% in the fall of 2008.
 
The CPI inflation in the US is also still relatively subdued. Excluding food and energy, June’s core CPI matched May’s 0.3% gain, which was the largest monthly increase since the summer of 2008. The core rate showed little change all last year, starting 2010 with the first m/m decline since 1982. In June, higher motor vehicle and apparel prices accounted for the larger-than-expected gain. The y/y core rate rose to an 18-month high of 1.6% from a record low of 0.6% last October. The 3-month rate was 2.9% (saar), climbing steadily from October’s 0.4%. That’s the biggest gain since August 2008.


Tuesday, July 19, 2011

The Price of Gold

The price of an ounce of gold rose over $1,600 yesterday. I have frequently observed that gold is a hedge against out-of-control governments. It is a hedge against reckless fiscal and monetary policies. Often in the past, such policies led to higher inflation, which is why gold is widely perceived as a hedge against inflation. However, reckless government economic policies can also lead to financial ruin and deflation.

The price of gold is up at a record high in all the major currencies, suggesting that out-of-control governments are a worldwide plague. The nominal average price in dollars rose to $1,528 during June. In real terms, using the CPI as the price deflator, the price rose to $682, which was still below, but nearing, the record high of $865 during January 1980.


There is an interesting close correlation between the price of gold and the sum of US Treasuries and Agencies held by the Fed and foreign central banks. This shows that the price goes up as banks monetize the swelling debt of the US government. By doing so, reckless monetary policy accommodates reckless fiscal policy! (We regularly update these charts for subscribers to our service in  Currencies & Gold). 

Sunday, July 17, 2011

US Retail Sales


Social insecurity. I have a few relatives who are senior citizens. They depend on their Social Security checks. They are very upset. On Tuesday, July 12, President Barack Obama told CBS News that Social Security checks and veterans’ payments could be threatened if Congress doesn't pass legislation to raise the debt ceiling by the August 2 deadline. “I cannot guarantee that those checks go out on August 3 if we haven't resolved this issue, because there may simply not be the money in the coffers to do it,” he said. “This is not just a matter of Social Security checks,” Obama added. “These are veterans’ checks, these are folks on disability and their checks. There are about 70 million checks that go out.” I guess this proves that there really is nothing in the bogus Social Security Trust Fund.

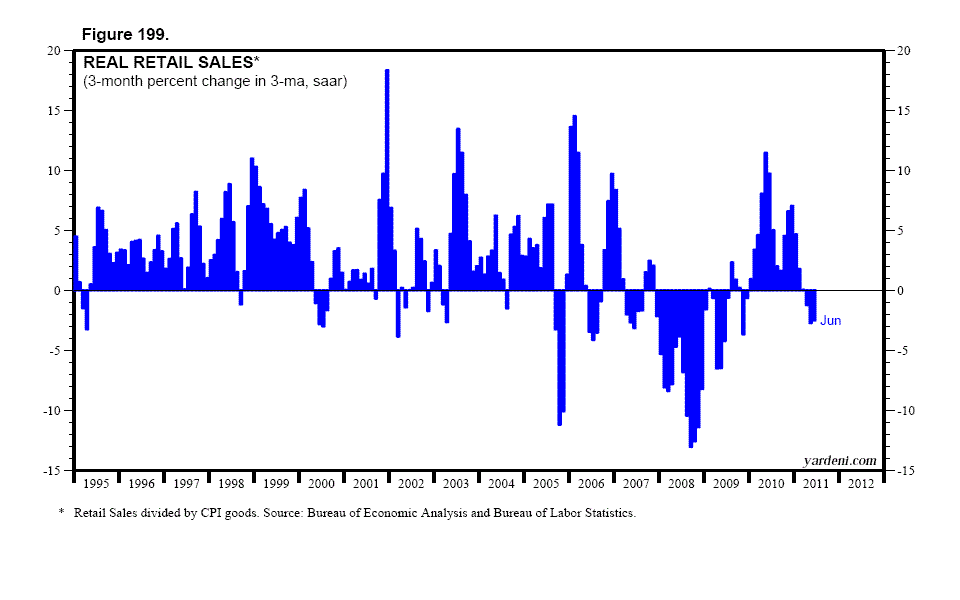
It’s very irresponsible to scare so many people this way. It could certainly exacerbate the soft patch. Millions of people are all likely to hunker down and spend much less during the rest of July fearing that they won’t get their checks in August. They were already hunkering down during the second quarter according to June’s retail sales report. The three-month average of inflation-adjusted retail sales fell 2.5% (saar) compared to the average during the first quarter, when it was unchanged.


Much of the weakness in retail sales over the past three months was in auto sales as a result of the spike in gasoline prices and the shortage of new cars attributable to supply disruptions following Japan’s earthquake. Excluding autos, inflation-adjusted retail sales rose 0.5% (saar) during Q2 compared to a 0.1% downtick during Q1.

Retail sales should pick up in coming months. The average national gasoline pump price fell to $3.57 a gallon over the past seven weeks after peaking at $3.96 during the week of May 18. Initial unemployment claims fell to 405,000 during the week of July 9. That was the lowest reading since mid-April. That week included the 4th of July holiday, which may have depressed claims. On the other hand, Minnesota had approximately 11,500 of their reported initial claims caused by state employees filing due to the state government shutdown. Jobless claims should drop below 400,000 in coming weeks, confirming that the economy may be coming out of the soft patch.


Thursday, July 14, 2011

S&P 500 Earnings

Financials have been a drag. The consensus expected earnings for this S&P 500 sector for 2011 dropped 2.3% during the week of July 7 to a new low of $15.31 per share. This estimate is down 18.2% from a year ago and 23.3% from two years ago. The sector’s forward P/E peaked at 17.6 during September 2009 and is now down to 11.3. The sector has been underperforming the S&P 500 since April 2010. We’ve rated it an underweight since October 18, 2010 and continue to do so.
The Financials sector is starting to weigh on the overall S&P 500. The composite’s 2011 consensus earnings estimate fell 1.4% over the past two weeks through July 8. This figure actually continues to flatline, as it has been doing since mid-2009.

The recent drop in earnings expectations for the Financials has had a noticeable impact on the second quarter’s consensus earnings expectations for the S&P 500. Before Bank of America announced its big earnings hit on June 29, the S&P 500 earnings consensus was at $24.43 during the week of June 24. It dropped by $1.35, or 5.5%, to $23.08 during the latest week of July 8.


Wednesday, July 13, 2011

China's M2 and Bank Loans

There is a shortage of pigs in China. Meat prices rose 32.3% y/y in China’s June CPI, led by soaring pork prices. This was the major contributor to driving food prices up 14.4%, the highest since June 2008, when rapidly rising pork prices were also a big problem. The overall CPI rose 6.4% y/y, up from 5.5% during May. Excluding food, it was up 3.0%.

The People’s Bank of China (PBOC) has responded to mounting inflationary pressures by raising the official rate three times this year. However, there isn’t much that monetary policy can do to increase the supply of pigs, though it can certainly depress the demand for pork by causing a recession. So far, tighter monetary policy hasn’t done much to depress the growth rates of either bank loans or M2 in China. Nor has it slowed the economy, as widely feared.


China’s M2 jumped 1741 billion yuan in June. On a y/y basis, it is up 15.9% in yuan and 21.9% in dollars. China’s M2 is now 33% greater than America’s M2. In 2000, it was only 30% as large as America’s M2! Financial institutions issued 633.9 billion yuan of new loans in June, up from 551.5 billion yuan in such lending during May. On a y/y basis, loans are up 15.2% in yuan and 21.3% in dollars. A flood of bank lending in recent years has been one factor driving up consumer prices.

China’s second-quarter GDP rose 9.5% y/y, compared with 9.7% growth during Q1. The rate of growth increased on a sequential basis to 9.1% (saar) during Q2 compared with 8.7% during Q1. Industrial production growth in June also came in much faster than expected, rising 15.1% y/y, compared with 13.3% in May.