Thursday, July 28, 2011

Capital Goods Orders & Shipments

The 2.1% drop in June durable goods orders disappointed investors and contributed to yesterdays’ stock market retreat. However, the series is very volatile. Particularly volatile are civilian aircraft orders, which declined 28.9% during June. Also volatile lately have been automobile orders, which are actually the same as the industry’s shipments. They dropped 6.3% over the past three months, mostly because of a shortage of parts made in Japan.

Yet it is heartening to see that over the past three months through June, nondefense capital goods shipments excluding civilian aircraft rose 9.3% (saar) compared to the previous three months, to a new cyclical high. That’s up from March’s 3.9% increase. This augurs well for capital spending. Q2’s real GDP will likely show that capital spending on equipment and software rose faster than Q1’s 8.8% (saar).

 
Admittedly, durable goods orders were disappointing. However, they are volatile, as noted above. Nondefense capital goods orders excluding civilian aircraft rose 16.5% (saar) over the past three months through June compared to the previous three months. That’s not disappointing at all.


Wednesday, July 27, 2011

Jobs & Home Prices

Anyone who might have been expecting a rebound from the soft patch during August and September is likely to be disappointed. That’s because the clowns in Washington are making people cry rather than laugh. The daily barrage of doomsday predictions expressed by top White House and Congressional officials must be depressing both spending by lots of consumers and hiring by lots of companies.

Nevertheless, we expect that initial unemployment claims will soon drop back below 400,000. They did so earlier this year, but have been above that level since the week of April 2. We believe that the ongoing strength in corporate profits should reduce the pace of firing by employers. However, we are concerned that the pace of hiring might remain weak given the uncertainties created by ongoing gridlock in Washington.

One way to gauge the pace of hiring is to monitor the “jobs hard to get” response compiled monthly in the Conference Board’s survey of consumer confidence. It edged up to 44.1% from 43.2% in June. It has been hovering between 42.0% and 50.0% since early 2009. It tends to be a lagging indicator of the labor market during recoveries, especially when compared to initial jobless claims. That makes sense since the pace of firing has to drop before the pace of hiring is likely to increase during recoveries.

Given the lackluster pace of hiring as reflected in the “jobs hard to get” response, it’s not surprising that the Conference Board’s Consumer Confidence Index (CCI) remains relatively depressed this far into an economic recovery. The index did edge up to 59.5 in July, well below its previous cyclical high of 111.9 during July 2007. At 35.7, the CCI Present Situation component is considerably below its March 2007 peak of 138.5.

Also depressing consumer confidence must be the continued weakness in home prices. There was a small m/m uptick in the S&P/Case-Shiller 20 Metros Home Price Index during May. However, the 12-month average of the median existing home price compiled by the National Association of Realtors remained around a cyclical low of $170,000 during the three months through June. Prices haven’t been this low since the spring of 2003, and are down a whopping 24.3% from the record high of $224,283 during July 2006.


Monday, July 25, 2011

Global Oil Demand

World oil demand rose to a record 88.9mbd during June, using the 12-month average to smooth out seasonal volatility. On a y/y basis, it was up 2.5% last month. As a very rough approximation, we double this growth rate to get a rough idea of the growth in world GDP. So, the oil demand data suggest that global economic growth is relatively strong around 5%.

We also disaggregate the data between the Old World (US, Western Europe, and Japan) and the New World (everyone else). The former edged down to 38.1mbd, still well below its record high of 41.9mbd during August 2005. The latter rose to a new record high of 50.8mbd last month.


Old World oil demand is up only 0.9% from a year ago and down 1.1% from two years ago. New World oil demand is up 3.7% and 8.9% over those same two periods.

US Government Outlays & Receipts


I still expect that there will be an agreement in Washington to raise the debt ceiling soon. However, just out of curiosity, let’s review the actual budget numbers over the past 12 months through June and use them to consider what might happen if the government had to balance its budget effective immediately.

Over the past 12 months, federal outlays totaled $3,559.5 billion, well exceeding tax receipts, which totaled $2,298.8 billion. So over the past 12 months, spending would have had to be reduced by 35.4% to balance the budget. (Of course, that ignores that doing so would have depressed economic activity and tax revenues.)

What government spending would be cut to balance the budget if the debt ceiling isn’t increased? The first priority almost certainly would be to make good on interest payments on the federal debt. That number was $220.8 billion over the past 12 months. Social Security obligations should also be met. They totaled $725.2 billion over the past 12 months. So to balance the budget over the past 12 months would have required a 49.2% slashing of outlays excluding those on interest and Social Security.

In Friday’s WSJ, Thomas R. Saving, a former trustee of the Social Security and Medicare Funds, disputed President Barack Obama’s assertion that “there may simply not be the money in the coffers” to send out Social Security checks if the debt ceiling isn’t raised. In fact, the Social Security trust fund has about $2.5 trillion in special nonmarketable bonds issued by the Treasury. Since it isn’t earmarked, the money is gone, having been spent along with other tax revenues on the government’s general expenses.

However, the trustees of the fund could redeem the special bonds to raise the monies needed to send out checks to Social Security recipients. Mr. Saving notes, “By law the Treasury is bound to redeem any bonds presented to it by the Social Security Administration. And when the Treasury does, total government debt subject to the debt limit falls by the amount of the redemption--thus freeing up the Treasury’s ability to issue new bonds equal in amount to the redeemed Trust Fund bonds.”

If we can’t trust in the trust funds set up by the government to fund our retirements, and if we can’t trust our lawmakers to raise the debt limit and reduce the federal deficit to assure financial stability, what should we do? What many of us are doing is putting our trust in gold. This morning, the price of gold is at a new record high of $1,619 per ounce. It may be rapidly converging to $2,516, which is the inflation-adjusted equivalent of the June 1980 record high.

Thursday, July 21, 2011

S&P 500 Revenues & Profit Margin

Globalization isn’t wonderful for everyone. However, it is wonderful for S&P 500 corporations. More and more of them are finding more and more of their revenue and profit growth overseas, as evidenced by the Q2 results of Apple, IBM, and Coca-Cola.

Nominal GDP rose only 3.8% during 2010 compared to 2009 in the US. Yet, S&P 500 revenues rose 8.6% in 2010. Excluding Financials it was up 9.5%. On the other hand, excluding Energy it was up 6.5%, but that still well outpaced the growth in US nominal GDP.

This year, the consensus estimate of revenue growth for the S&P 500 is 9.2%, and 11.2% excluding Financials. During the week of July 15, the estimate for 2011 was $1,034.68 a share, near the highest reading so far this year. The same can be said about the 2012 estimate of $1,097.15.

 
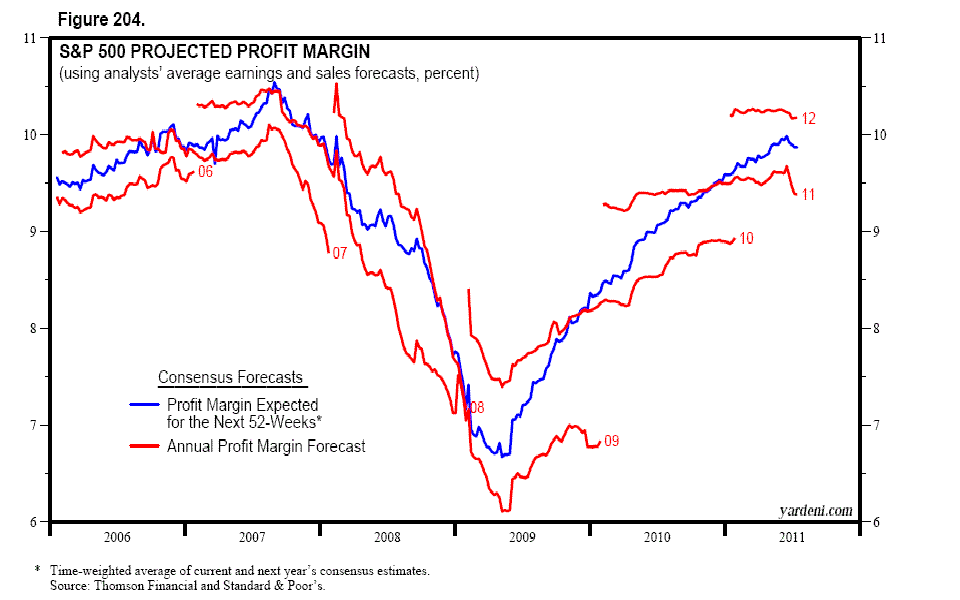
As for 2012, industry analysts are cautiously optimistic, with a projected growth rate of 6.0% for S&P 500 revenues. Given the slowdown in the expected growth of revenues next year, why do industry analysts expect that S&P 500 earnings will rise 15.7% to $113 a share? Their estimates for these two variables imply that they expect that the profit margin of the S&P 500 will rise to 10.2% next year from 9.4% this year.

More likely is that S&P 500 earnings will rise 6.0% in 2011 to $105 a share from $99 this year. That’s because it’s hard to see any upside in the profit margin given that it is back to the previous cyclical high already. There may not be much downside either given the focus on containing costs and boosting productivity. So earnings should grow at the same pace as revenues, which should be around 6%, that should beat the growth rate in US nominal GDP thanks to Globalization.