![]() |
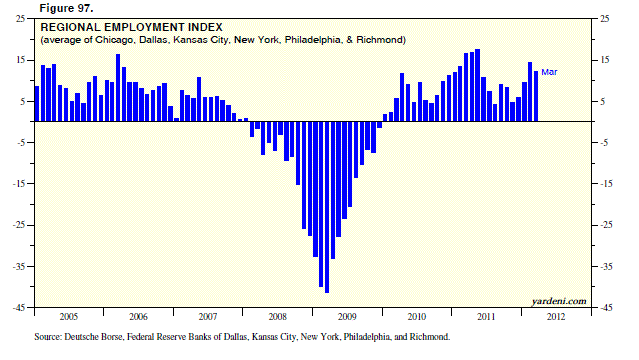
The government’s disappointing employment report for March supports the notion that seasonal factors and mild winter weather boosted employment during January and February, so that March was the payback month. If that is so, then why not simply average the three months to see what’s really happening in the labor market? The results suggest that the labor market is improving. Consider the following: (1) The three-month average gain of payroll employment remains solid. Payrolls rose 211,700 per month on average during Q1-2012 vs. 164,000 during Q4-2011 and 127,700 during Q3-2011. Private-sector payrolls rose 210,300 on average during Q1 according to the official tally, in line with the 207,000 average gain for the payrolls tracked by ADP. (2) The index of aggregate weekly hours worked for total private industries rose at a solid pace during Q1. It was up 3.7% (saar), following increases of 2.5% during Q4-2011 and 1.1% during Q3-2011. (3) The household employment survey is up 414,700 per month on average over the past three months. That compares to gains of 227,700 during Q4-2011 and 240,700 during Q3-2011. (4) According to the household survey, full-time employment rose 882,000 during March! That’s not a typo, and that’s after it rose 563,000 during February. On the other hand, part-time employment fell 664,000 during March after falling 163,000 during February. Full-time employment is up 4.8 million since its latest cyclical trough during December 2009 to the highest level since the start of 2009. Also consider the latest batch of other employment indicators: (5) During March, initial unemployment claims averaged 361,750, falling steadily from September’s average of 410,500. That’s a clear sign that the pace of firing is continuing to decline. (6) A monthly employment index, which can be constructed from the available regional surveys conducted by the Fed districts and purchasing managers associations, remains strong. So far for March, data are available for the regions around the following cities: Chicago, Dallas, Kansas City, New York, Philadelphia, and Richmond. The average of these regional indexes fell from 14.5 during February to 12.2 last month. That’s still a relatively high reading. (7) On Wednesday, Gallup reported a four-point jump in the polling firm’s Job Creation Index from 14 in February to 18 in March. That’s the best reading since August 2008. The latest poll also found that the pace of hiring is picking up: “The March Job Creation Index reflects 35% of U.S. adult workers saying their employers are hiring and expanding the size of their workforces, and 17% saying their employers are letting workers go and reducing the size of the workforces. While the percentage letting go matches what Gallup found in January, the percentage hiring is at a 42-month high, last seen in September 2008.” (8) The employment component of the national manufacturing purchasing managers index (M-PMI) jumped from 53.2 in February to 56.1 in March, the best reading since last June. The nonmanufacturing survey’s employment index increased from 55.7 in February to 56.7 in March. The average of the M-PMI and NM-PMI employment indexes rose to 56.4 in March, the highest since last June. (9) Wednesday’s ADP report also confirmed that the labor market remained strong during March. During Q1, the average gain was 207,000, little changed from Q4’s 211,700 and considerably above the 99,000 average during Q3 of last year. Today’s Morning Briefing: A Positive Spin (1) Employment looks good, on average. (2) Full-time employment soaring! (3) The weight of the employment evidence is upbeat. (4) What should we be rooting for: QE3 or jobs? (5) Goldilocks on ice. (6) The déjà vu scenario for 2012. (7) Central banks are running out of ammo and into inflation flak. (8) What if the Republicans take it all? (9) Is little guidance bullish or bearish? (More for subscribers.) |
Monday, April 9, 2012
US Employment
Thursday, April 5, 2012
Europe's Recession
![]() |
On Monday, March 26, I downgraded Europe to an underweight among global stock markets. The latest batch of economic indicators confirms that the region is in a recession. M2 money supply growth rates are plunging in Greece (down -16.8% y/y through February), Spain (down -4.7%), and Portugal (-3.8% through January). It is up only 1.3% through February in Italy. Germany’s M2 is up 7.5% y/y through February. Some of that growth is coming from Greece, Portugal, and Spain, where money supplies are falling as depositors move their funds to banks they deem to be safer in Germany. That’s not helping the German economy. This morning, we learn that German industrial production fell 1.3% in February to the lowest level since January 2011. It is down 4.6% from last year’s cyclical high during July. German manufacturing orders edged up 0.3% during February, but also remain well below last year’s high. Foreign orders for German capital goods and consumer goods from the Euro Area are down sharply in recent months. TODAY’S BULLET POINTS: (1) Wobbling around 1400. (2) Overbought. (3) Bears wanted. (4) Goldman’s call of the mild. (5) FOMC says economy improving, maybe. (6) Are falling commodity prices bullish? (7) Continuing to underweight Europe. (8) Why do analysts expect big jump in earnings growth? (9) A happy bunch of US employment indicators. (10) Europe is falling into a recession. (More for subscribers.) |
Wednesday, April 4, 2012
Mutual Fund Net Inflows & Capital Gains
![]() |
Over the past 36 months through February, net inflows into bond mutual funds totaled $1.0 trillion, while net inflows into equity funds were close to zero. Unfortunately for bond investors, the equity funds enjoyed capital gains of $2.7 trillion over this period, while the bond funds had gains of only $437 billion. Now that bond yields are starting to move higher, those gains are likely to decline. That might convince individual investors to move back into equities. TODAY’S BULLET POINTS: (1) When good news is not bad. (2) Twisted Fed policy. (3) Consumers and businesses are loaded with liquidity. (4) Banks holding record $3.34 trillion in cash, Treasuries, and Agencies! (5) Do we really need more QE? (6) A classic liquidity trap? Not! (7) Monetary policy is really fiscal policy. (8) FSMI still bullish. (9) Warm weather slows railcar loadings of coal. (10) Railcar loadings of autos at cyclical high. (More for subscribers.) |
Tuesday, April 3, 2012
Weekly Leading Index
![]() |
The ECRI’s Weekly Leading Index may be about to defy its bearish handlers. It rose for a fifth consecutive week on March 23 back to its early August high. The compilers of this index at the Economic Cycle Research Institute have been adamantly predicting a recession despite the rebound in their index. In their opinion, it has been distorted by seasonal factors, so they focus on its y/y growth rate. They may have to change their forecast if this growth rate continues to rebound from a recent low of -6.7% at the end of last year to -3.3% during the latest week. TODAY’S BULLET POINTS: (1) Bullfighting in Spain. (2) Kohler in China. (3) Covering up the Euro Mess. (4) Stocks tend to rise in April. (5) Expectations are not great for Q1 earnings season. (6) Profits from abroad slowing along with global economy. (7) Profits growth for Financials positive, but subdued. (8) Nonfinancial domestic profits should be good. (9) Mixed picture for the sectors. (10) Expecting positive surprises among Consumer Discretionary and IT. (11) Mixed picture for global economy. (12) Services are red hot in Red China. (More for subscribers.) |
Monday, April 2, 2012
US Regional Business Surveys
![]() |
If today’s national purchasing managers index (PMI) for March confirms the strength of the economy, the naysayers will remind us how warm the weather was last month. If it is weak, they will score some points. They claim to have done so with all the downticks in the March readings of the regional business surveys conducted by the Fed districts. I track the average of the composite indexes for the Fed districts around Dallas, Kansas City, New York, Philadelphia, and Richmond, along with a comparable Chicago PMI. It declined from an 11-month high of 17.2 during February to 13.8 during March. The average new orders index for these six regions fell from 14.7 in February to 11.6 in March. Their average employment index fell from 14.5 to 12.2. All of those are relatively high readings, with all well exceeding zero. TODAY’S MAJOR BULLET POINTS: (1) Let the games begin! (2) Is the US economy’s winning streak over? (3) Bernanke is the bull’s cheerleader. (4) Record bond calendar pumping up stocks. (5) The Persian Gulf games. (6) Chinese workers unchained to buy iPads. (7) Europeans fighting not to lose. (8) After great Q1, fight or flight in Q2? (9) Do the odds favor US economy? (10) The districts continue to perform well. (11) “The Hunger Games” (+ +). (More for subscribers.) |
Subscribe to:
Posts (Atom)