Tuesday, August 18, 2015

China’s Known Unknowns (excerpt)

In a 7/15 release on Q2’s GDP, the Chinese National Bureau of Statistics said that China’s economy is “moving forward while maintaining stability.” Real GDP rose 7% y/y. The release observed that Chinese officials “unswervingly pushed forward the system reform and institutional innovation.” What does that mean? Recent events since then suggest that they are spending more time learning how to manipulate the financial markets.

They have long been charged with manipulating China’s economic data to show more strength. “China has a history of ironing out the ruffles in its growth figures,” according to a 7/15 article in The Economist. “No less an authority than Li Keqiang, now the premier, once said that local GDP data were ‘man-made and therefore unreliable’.”

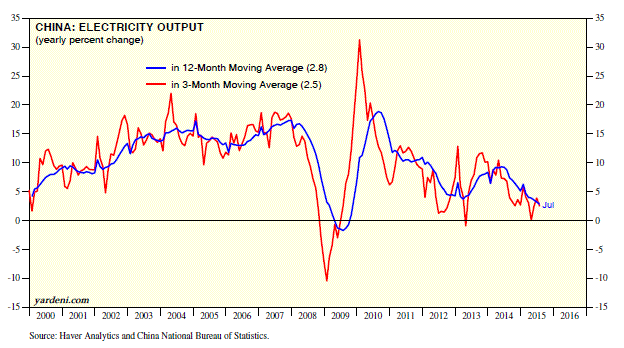
The 8/14 The Guardian includes an article titled “Five reasons to be worried about the Chinese economy.” It observes: “The Economist has developed an unofficial ‘Keqiang index’, based on Li’s own technique of looking at indicators such as electricity use and rail freight volumes to assess what is really going on in the economy.” Sure enough, rail freight volumes were down 11.7% y/y through June. Electricity production was up just 2.8% y/y during July (using the 12-month average), the slowest since October 2009. Using similar measures the London-based consultancy Fathom estimates China is really growing at 3.1% a year, not 7.0%!

Today's Morning Briefing: GDP Growth Is MIA. (1) The demand and supply sides of secular stagnation. (2) Abenomics lost its mojo during Q2. (3) Need to squint to see Eurozone’s growth. (4) China’s many known unknowns. (5) Keqiang index shows weakening Chinese economy. (6) Brazil’s masses protesting the messes. (7) US economy isn’t stagnating, but it isn’t booming either. (8) The Donald Trump of economies. (9) Gatsby has left the building. (More for subscribers.)
Monday, August 17, 2015

S&P 500 Revenues Up a Bit Excluding Energy (excerpt)

The latest readings on business sales show that the plunge in oil prices and the soaring dollar are weighing on revenues growth:

(1) Business sales with & without petroleum. Business sales are down 2.5% y/y through June. Over this period, manufacturing shipments and distributors’ sales of petroleum products are down 25.8%. Excluding these products, business sales are up, but only by 1.3%. Last June, these non-petroleum sales were up 3.3%. This weakness is probably attributable mostly to the strong dollar’s depressing impact on exports. (Remember, this measure doesn’t include sales of goods and services produced and sold abroad by foreign subsidiaries.)

(2) Exports. Merchandise exports accounts for 26% of manufacturing shipments. The growth rate of the former is highly correlated with the growth rate of non-petroleum manufacturing shipments. Exports fell 6.3% y/y during June. A year ago, exports were up 2.5% y/y.

(3) The dollar. In addition to depressing US exports, the strong greenback directly reduces the dollar value of revenues and earnings from overseas operations. There is a strong inverse correlation between the trade-weighted dollar (TWD) and the growth rate in S&P 500 revenues. That’s because roughly 50% of S&P 500 revenues comes from abroad. The TWD is up 16% y/y. This implies that over the past year, the dollar has reduced S&P 500 revenues by 8.5%.

(4) Oil price. The price of a barrel of Brent crude oil is down about 52% y/y. The S&P 500 Energy sector accounted for about 10% of S&P 500 revenues a year ago. So it has knocked 5% off of revenues over the past year.

(5) Combined effect. The bottom line is that together lower oil prices and the stronger dollar have knocked almost 15% off of revenues compared to a year ago. On Friday, S&P reported that revenues were actually down only 3.7% y/y for the S&P 500. There has continued to be good revenues growth in some of the major sectors of the S&P 500. In fact, excluding Energy, revenues rose 1.7%. The revenues performance derby for the 10 S&P 500 sectors is as follows: Health Care (8.3% y/y), Information Technology (4.1), Financials (4.0), Telecommunication Services (2.4), Consumer Discretionary (1.6), Consumer Staples (1.0), Industrials (-3.8), Utilities (-4.8), Materials (-9.9), and Energy (-31.7).

Today's Morning Briefing: Gilded Ages. (1) Back to the future in Newport, RI. (2) Gatsby didn’t sleep here. (3) The “cottages.” (4) Robber Barons, the 1%, and the rest of us. (5) Might inequality be a byproduct of prosperity? (6) Entrepreneurial vs. crony capitalism. (7) Upward revisions in retail sales bullish for Q2 & Q3 GDP. (8) More records for standard of living. (9) Oil and dollar weighing on revenues, but analysts say worst is over. (10) Revenue winners and losers among the S&P 500 sectors. (11) Revisions show NIPA profit margin peaked during Q1-2012. (12) Business sales & GDP and vice versa. (13) Focus on market-weight-rated S&P 500 Retail industry. (More for subscribers.)

Thursday, August 13, 2015

Earnings: Looking Good Again Excluding Energy (excerpt)

Over the past year, S&P 500 earnings have been suffering mostly from the plunge in oil prices and the strength of the dollar since last summer. This syndrome may continue for a while given the renewed weakness in oil prices and strength in the dollar.

Let’s calculate the y/y percent change in the 10 S&P 500 sectors during Q2 based on the blend of the available actual and analysts’ estimated earnings. Here is what we find:

Consumer Discretionary (12.0% vs. 7.1% at the start of the Q2 earnings season on July 1st), Consumer Staples (0.2 vs. -2.9), Energy (-56.2 vs. -62.8), Financials (20.7 vs. 14.8), Health Care (11.5 vs. 4.1), Industrials (-1.3 vs. -1.1), Information Technology (5.5 vs. 2.1), Materials (8.5 vs. 4.9), Telecommunication Services (9.3 vs. 5.5), and Utilities (4.5 vs. 0.5).

Three of the sectors are up with double-digit gains. All but Industrials are turning out to be better than was expected at the start of the earnings season. S&P 500 earnings was expected to be down 3.0% y/y during Q2 at the start of the season. The latest numbers show a gain of 1.6%. Excluding Energy, it is up 10.2%. That’s impressive and follows a similar pattern as during Q1, when S&P 500 earnings rose 1.5%, but 11.5% excluding Energy.

The recent renewed weakness in the price of oil could continue to weigh on Energy earnings through the end of this year. The renewed strength in the dollar in recent weeks could also weigh on the overall S&P 500, where at least 50% of revenues comes from overseas. I did cut my earnings estimates for 2015 and 2016 sharply at the end of 2014 and again early this year to reflect the negative impacts of lower oil prices and a stronger dollar. I may have to trim a little more, but I am not doing so just yet.

Today's Morning Briefing: China’s Critical Mess. (1) Fukushima Syndrome. (2) China’s central bankers and central planners have a credibility problem. (3) Trump dumps on China too. (4) Endgame scenario making a comeback. (5) From critical mess to critical mass. (6) The US is a net winner. (7) Need a magnifying glass to see Eurozone recovery. (8) China has two options. (9) Hold the MSG. (10) Earnings are fine excluding Energy. (11) Upside Q2 earnings surprises aren’t surprising. (12) Another Chinese fire drill at the FOMC? (More for subscribers.)

Wednesday, August 12, 2015

Global Secular Stagnation or Worse? (excerpt)

In recent months, I’ve observed that most of the global economic indicators suggest a scenario of secular stagnation, with neither a boom nor a bust. The OECD Leading Economic Index is leaning more in the direction of a bust, but I’m not convinced.

During June, the index for the 34 advanced economies that are members of the OECD fell to 100.0, the lowest reading since June 2013. Among the weakest components of the overall index is the US LEI, which fell to 99.4, the weakest since November 2011. Sorry, that doesn’t make any sense to me. Making more sense is the LEIs for the BRICs, which all remained below 100 during June.

Then, again the weakness in the CRB raw industrials spot price index is of concern to me. I also note that Japan’s exports and imports remained lackluster during June.

Today's Morning Briefing: Shock Without Awe. (1) How do you say “Godot” in Chinese? (2) Another desperate measure for desperate times in China? (3) Professor Copper gives Chinese a big thumbs down. (4) El-Erian makes sense of it all. (5) Not enough growth to go round, so steal some with cheaper currency. (6) Chinese are in good company. (7) Clueless in Beijing. (8) Chinese savings glut fueling massive misallocation of capital. (9) OECD leading indicators turning weaker. (10) Fed’s talking heads talking. (11) One-and-done this year followed by none-and-done next year? (More for subscribers.)

Tuesday, August 11, 2015

China Is a Mess (excerpt)

The rebound in Chinese stocks on Monday is consistent with the bad-news-is-good-news performance of stock markets around the world since the financial crisis of 2008. That’s because bad news is viewed as likely to spur the central bankers to provide another round of easing. There were lots of downbeat indicators coming out of China in recent days.

As we noted yesterday, on a seasonally adjusted basis, imports fell 2.1% m/m and 8.1% y/y. Some of that weakness reflected the drop in oil prices. However, imports excluding petroleum still fell 3.4% y/y during June, suggesting weak domestic demand. Exports declined 4.9% m/m last month and 8.3% y/y, likewise suggesting weak global demand. Exports have been essentially flat now since early 2013.

July’s PPI was down 5.4% y/y. That’s the 41st consecutive monthly decline, and the worst since October 2009. There were lots of devils in the details for the various industrial categories: ferrous metals (-20.1% y/y), coal (-15.1), raw materials (-9.7), nonferrous metals (-7.7), heavy industry (-6.3), manufacturing (-4.5), chemicals (-3.1), and light industry (-1.1).

The underlying mess in China may be best reflected in the country’s rapidly rising capital outflows. Over the 12 months through July, the trade surplus totaled $541 billion, a tad below June’s record high. Over the same period, China’s nongold international reserves fell by a record $318 billion. This implies record capital outflows totaling $859 billion over the past 12 months through July.

The only positive spin is that China is lending lots of money to the ’Stans (Afghanistan, Kazakhstan, and Pakistan) to build the Silk Road project, which will boost China’s exports and absorb much of its domestic excess manufacturing capacity. The only problem with this theory is that most of the project is still on the drawing boards. More likely is that anyone with money in China is doing what they can to get it out of there, and fewer foreigners are interested in investing in China.

Today's Morning Briefing: Behind the Curtain. (1) What’s different this time that technicians aren’t seeing? (2) Warren Buffett’s latest deal offsets bearish technical signals. (3) Corporate funds driving bull market more than the investment public. (4) Individual investors mostly on the sidelines. (5) Institutional equity investors (excluding equity funds) are net sellers. (6) Foreigners selling US equities this year. (7) Corporations massively buying shares through buybacks and M&A deals. (8) The wizards behind the curtains in the US and China. (9) Chinese-style QE is sweet and sour. (10) Is greed back in China already? (11) Bad news is good news in China. (12) OPEC no longer the Fed of oil market. (More for subscribers.)