 |
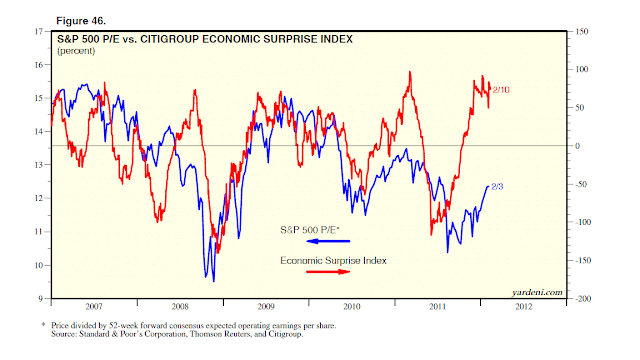
In a new publication, we chart the relationship between the S&P 500’s forward P/E and various indicators of Risk On/Off since 2007. There is a very high correlation between this P/E and the Citigroup Economic Surprise Index, the 10-year Treasury bond yield, expected inflation in the TIPS market, industrial commodity prices, the price of crude oil, the euro, and the inverse of the trade-weighted dollar. Let's dive in by reviewing the performance of the S&P 500's P/E since 2007. It has swooned three times and then recovered: (1) It dropped 38.4% from a cyclical high of 15.4 during the week of June 1, 2007 to a cyclical trough of 9.5 during the week of November 21, 2008. It then rebounded 57.9% to a cyclical peak of 15.0 during September 18, 2009. (2) It took a dive from the 2010 peak of 14.6 during the week of January 15 down to 11.5 during the week of August 27, 2010. It then rebounded again to a 2011 peak of 13.5 during the week of February 18. (3) It fell during the spring of 2011 and took another dive last summer to a low of 10.4 during the week of August 12. Since then, it has rebounded 19.2% to 12.4 in early February. Can the market's P/E move still higher? I think it could rebound back up to 14-15. It has certainly lagged behind the rebound in the Citigroup Economic Surprise Index. This index is up sharply from a 2011 low of -117% on June 3 to 73% on February 10. It is back at its previous five cyclical highs. However, the P/E has been peaking at lower lows since early 2007. (A positive reading of the Economic Surprise Index shows that economic releases on balance are beating the consensus. The more the data moves forex markets, the more significant its weight in the index. It is calculated daily on a rolling three-month basis and using a time decay function to replicate the limited memory of markets.) In the past, the market’s valuation multiple tended to rise when bond yields decreased, and vice versa. In the past, rising inflationary expectations often were negative for equity valuations, while falling ones were positive. There relationships have turned topsy-turvy since early 2007, when falling yields and inflation rates started to be associated with falling rather than rising P/Es. That’s because yields and inflation rates are so low that investors fear that they may be harbingers of deflation and depression. So why haven’t bond yields risen along with the P/E since late last year? The Fed’s Operation Twist has clearly distorted the bond market. Without it, yields would have undoubtedly risen. They still could if the program is terminated on schedule at the end of June. Meanwhile, the expected inflation rate embodied in the 10-year TIPS market has risen from a low of 1.7% on October 3 to 2.2% in early February. So far, that's been bullish for the P/E. (More for subscribers.) |
Sunday, February 12, 2012
S&P 500 Forward P/E
Subscribe to:
Post Comments (Atom)


No comments:
Post a Comment