Monday, September 30, 2013

Commodity Prices Aren’t Bullish for Emerging Markets (excerpt)


Gold rallied briefly on September 18 when the FOMC decided not to start tapering QE. The rally fizzled quickly. I view gold as an indicator of the underlying trend in commodity prices, particularly of the CRB raw industrials spot price index. This index didn’t rally on the Fed’s decision. It’s been mostly flat this year, and remarkably so since the summer despite mounting signs of better growth in Europe and China.

We recently created a new publication tracking the CRB index versus the stock price indexes and forward earnings of selected MSCI emerging market economies (EMEs). The correlations are mostly very high, especially for the major EME regional indexes, as well as the ones for Brazil, China, Mexico, and South Africa. So far, the CRB index does not confirm the recent rebounds in the EME stock price indexes.

Today's Morning Briefing: Dysfunctional Government. (1) Big Government weighing on global growth. (2) America is exceptional. (3) Halloween is a month early. (4) October can be bad, but a good buying opportunity for yearend rallies. (5) Policy uncertainty suppressing economic growth. (6) Nothing new: Italian government is unstable. (7) Mao is making a comeback in Beijing. (8) Lots of Indian politicians committing crimes. (9) Rising income inequality benefits Big Government most. (10) FSMI soaring, while commodity price index is flat-lining. (11) Earnings expectations very upbeat for 2015. (12) More recovering indicators in Europe. (13) "Rush" (+ +). (More for subscribers.)

Thursday, September 26, 2013

Jobs Are Less Hard To Get (excerpt)


There was a dip in the Consumer Confidence Index in September. However, the percentage of respondents to this survey who agreed that “jobs are hard to get” dropped to 32.7%, the lowest reading since September 2008. This isn’t a surprise since this series is highly correlated with initial unemployment claims, which is down to a new cyclical low on a four-week-average basis.

The jobs-hard-to-get series is also highly correlated with the unemployment rate, which could fall below 7.0% sooner than widely expected, especially by members of the FOMC. That could be interesting since Fed Chairman Ben Bernanke said at his June 19 press conference that QE would be terminated by the time the jobless rate fell to 7%. He seemed to back off from that assessment during his press conference last week on September 18.

Today's Morning Briefing: Breaking Bad. (1) Bad things might not happen. (2) Middle East always risky, but not imminently so for markets. (3) If German court rules against OMT, Draghi ready with more LTRO. (4) Oil and bonds going off the boil. (5) The Fed’s super-easy "BDY Troika" in no rush to taper. (6) Another upbeat German indicator. (7) Improving jobs-hard-to-get survey sees jobless rate under 7% soon. (8) Analysts raising revenue estimates. (9) Bulls charging out of correction camp could mean a correction is coming. (10) Focus on overweight-rated S&P 500 Industrials. (More for subscribers.)

Wednesday, September 25, 2013

Government Support Increasingly Boosts Incomes (excerpt)


The National Income and Products Accounts (NIPA) show that the pre-tax compensation of workers dropped to 61.0% of national income during Q2. That’s the lowest since Q2-1955, and below the 65% average from the 1970s to the 1990s. Wages and salaries have been just below 50% of national income for each of the past 12 quarters; this is the first time that they’ve been that low on record, starting in 1948. They peaked at a record 59.0% during Q1-1970, and it has been all downhill since then. However, that’s partly because “supplements in compensation” (including health care) have increased from 6% of national income in the early 1960s to around 12% since the early 1990s.

The NIPA income shares analysis is pre-tax and before the government gets involved in redistributing income using tax revenues and borrowings. This explains why disposable income--which includes earned income (compensation), unearned income, and entitlements--remains around 85% of national income, as it has since the late 1940s.

The big story here is that entitlements (“government social benefits to persons”) has soared from less than 5% of national income in the early 1950s to recent record highs around 17%. The federal and state governments are currently redistributing income at an annualized rate of almost $2.4 trillion, which slightly exceeds the sum of federal income and payroll taxes. In effect, every tax dollar collected from workers by the federal government is redistributed to entitlement beneficiaries.

Today's Morning Briefing: On The (Profit) Margin. (1) Fairness and prosperity. (2) North Korea and Cuba are fair and impoverished. (3) Bill de Blasio’s tale of two cities. (4) The “5%” includes public employees. (5) The distribution of income between labor and capital. (6) Labor is losing, while capital is gaining. (7) Why are NIPA profits soaring, while S&P 500 net income is flat-lining? (8) NIPA profit margin measure at record high, while S&P 500 measure is at cyclical high. (9) Government is the great equalizer. (10) Your taxes at work supporting those who don’t. (More for subscribers.)

Tuesday, September 24, 2013

Upbeat US Economic Indicators (excerpt)


In the US, the latest batch of economic indicators has been relatively strong. The index of leading economic indicators rose 0.7% during August to the best reading since April 2008. A big jump in the ISM new orders index contributed to last month’s gain. So did a drop in initial unemployment claims to the lowest since October 2007. The interest rate spread component, which widened as bond yields rose, might not be such a positive development, as evidenced by the recent weakness in building permits.

So far, we have September data for the regional business surveys conducted by the FRB New York and the FRB Philadelphia. They were strong, with the averages of both their orders indexes and their employment indexes rising impressively. Markit reported yesterday that their flash M-PMI for the US edged down slightly from 53.1 in August to 52.8 this month, led by a drop in the new orders index from 55.7 to 52.7, while the output index rose from 52.5 to 55.3.

Existing home sales rose to a new cyclical high in August, though the pending home sales index for July edged down slightly from recent highs. The median existing single-family home price rose 14.4% last month, the fastest appreciation rate since October 2005.

Today's Morning Briefing: Less Uncertainty? (1) Placing odds. (2) Nothing to fear but another fiscal fiasco. (3) Latest batch of US economic indicators generally upbeat. (4) Global economic indicators showing some strength too. (5) S&P 500 revenues improving. (6) Forward earnings still making new highs. (7) Why subpar growth is bullish. (8) Secular bull case powered by broadening tech revolution. (9) Intelligent machines, cheaper solar panels, electric cars on auto-pilot, and a drop of blood. (More for subscribers.)

Monday, September 23, 2013

The Fed’s Inflation Target (excerpt)


The Fed’s inflation target (using the core personal consumption deflator) has been 2% for quite some time. It’s been below that rate since May 2012. At last week’s press conference, Fed Chairman Ben Bernanke said that the FOMC is considering setting an inflation floor. If inflation falls to or below this lower bound, then the federal funds rate won’t be raised even if the unemployment rate continues to decline. He added, “I mean, that we should be very reluctant to raise rates if inflation remains persistently below target and that's one of the reasons that I think we can be very patient in raising the federal funds rates since we have not seen any inflation pressure.”

It’s not obvious to me why Fed officials want to boost inflation. The recent decline in inflation has been led by such goods as airfares, used cars, and furniture and bedding. The biggest plunge has been in medical care commodities inflation. Medical services inflation has also been falling. On the other hand, tenant rent inflation rose during August to 3.0% y/y, the highest since May 2009.

Why would it be good for the economy to have rents rise faster? Do Fed officials really want medical care inflation to rebound? These are questions that the Fed chairman did not address in his press conference.

Today's Morning Briefing: Taper Caper. (1) Leaves will change before Fed does. (2) Fed officials concerned about weaker economy and fiscal follies. (3) Also, tapering postponed so yields would stop rising as a result of tapering talk. (4) Bond yield may stay between 2.5%-3.0% for a while. (5) Gold goes up and down. Industrial commodity prices barely budge. (6) Emerging markets unlikely to outperform. (7) Europe may not continue to outperform unless data improve. (8) US stocks face some challenges in October. (9) Bernanke’s last two press conferences confuse rather than enlighten. (10) “Prisoners” (+). (More for subscribers.)

Thursday, September 19, 2013

Stocks, QE, & Buybacks (excerpt)


Stock investors have become very addicted to QE. Everyone has been tracking the close relationship between the S&P 500 and the Fed’s holdings of securities since the start of the bull market in early 2009. The bears have been warning that if and when the Fed starts to taper QE and terminate it, the bull market will be terminated as well.

While the S&P 500 has been highly correlated with the Fed’s purchases of US Treasury and mortgage-backed securities, it has also been highly correlated with the sum of share buybacks and dividends paid by S&P 500 companies. The bears have been saying that the bull market has been a “sugar high” with no obvious buyers. Fed Chairman Ben Bernanke has been the sugar man, injecting the sweetener into stock prices with his ultra-easy monetary policies, especially QE.

The bears failed to either notice or acknowledge the huge injections of cash into the stock market by corporations. From Q1-2009 through Q2-2013, S&P 500 companies repurchased $1.5 trillion of their shares and paid out $1.1 trillion in dividends for a grand total of $2.6 trillion.

The Fed has pulled back from tapering QE for now, while corporations continue to announce lots of share buybacks and higher dividend payments. Life is good.

Today's Morning Briefing: Pullback & Buybacks. (1) The Fed and Providence. (2) Ben Bernanke and Emily Litella. (3) Back to QE-forever? (4) Fed adds fuel to the melt-up scenario. (5) Pay no attention to the Fed’s talking heads. (6) Transparency can be opaque. (7) Addicted to QE, but driven by corporate buybacks. (8) Life is good. (9) Focus on S&P 500 overweight-rated housing-related industries. (More for subscribers.)
Wednesday, September 18, 2013

Our Fundamental Indicator Remains Bullish for Stocks (excerpt)


Our Fundamental Stock Market Indicator (FSMI) rose to a new cyclical high of 116.0 during the first week of this month. It’s up 131% from its cyclical low of 50.2 during the week of February 7, 2009. It is only 8% below the previous cyclical peak during the week of May 5, 2007. Our weekly indicator reflects a combination of three components related to the fundamentals of the US economy: initial unemployment claims, the CRB raw industrials spot price index, and the Bloomberg Consumer Comfort Index.

Our FSMI has been highly correlated with the S&P 500 since 2000. So it is currently continuing to confirm the upward trend in stock prices based on the fundamentals. It turns out that our indicator is also highly correlated with the Weekly Leading Index compiled by the Economic Cycle Research Institute (ECRI). For the past year, the Institute has been declaring that the US economy is falling into a recession. That forecast has become less credible as even their index has risen since early 2012 to the highest level since April 30, 2010.

The components of the ECRI index are top secret. Ours are open source. The reality is that all the daily and weekly ingredients used to cook up the ECRI index are publicly available. It’s the recipe, i.e., which ingredients are used and how they are mixed, that’s proprietary. In addition to the fundamental indicators we use, the folks at ECRI probably include financial variables including the S&P 500 and the yield spread between high-yield bonds and the 10-year government bond. Both of our indicators are highly correlated with these two financial variables.

Today's Morning Briefing: The Best Indicator. (1) Fundamental Stock Market Indicator remains bullish. (2) FSMI vs. ECRI. (3) Top secret vs. open source. (4) Latest jobless claims distorted, but trend is down. (5) Weekly consumer confidence down, but on uptrend. (6) Industrial commodity price index flat-lining. (7) The best cure for high commodity prices. (8) That was a short super-cycle. (9) EMEs and commodity prices joined at the hip. (10) Will China grow fast enough to boost commodity prices again? (11) Focus on underweight-rated S&P 500 Materials. (More for subscribers.)

Tuesday, September 17, 2013

Forward Earnings Still Heading Higher (excerpt)

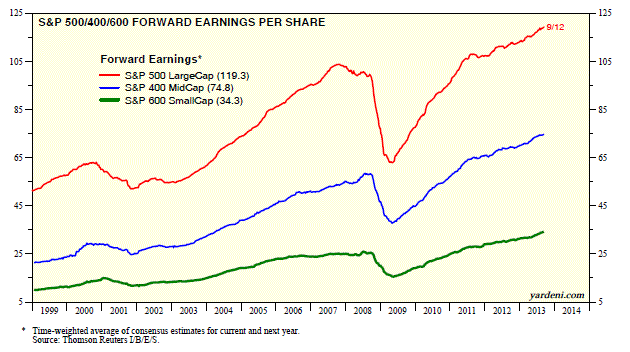
Today is Earnings Tuesday when I review analysts’ consensus earnings estimates. Yet again, I am impressed to see the forward earnings of the S&P 500, S&P 400, and S&P 600 rising to record highs last week. The S&P 500 forward earnings is at $119.29 per share and converging toward analysts’ consensus expectation for 2014, which has stabilized recently just under $123.

S&P 500 revenues expectations are available through the first week of September. The bottom line is that forward revenues, which has been more volatile than forward earnings, rose to a new record high (Fig. 7). I calculate that the forward profit margin rose to a new cyclical high of 10.3%, nearing the previous peak of 10.5% during the week of August 30, 2007.

Yesterday, I reviewed some of the latest economic indicators that might indicate where earnings might surprise to the upside and downside during the Q3 earnings season next month. Yesterday’s industrial production release for August suggests that positive surprises are likely from the following industries: auto products, appliances, furniture, carpeting, transit equipment, and industrial equipment.

Today's Morning Briefing: Yelling for Yellen. (1) Is anxiety a prerequisite for relief? (2) More anxious moments ahead for the latest relief rally? (3) If FOMC lowers jobless threshold, there’ll be more upside for stocks and bonds. (4) Yellen speeches tend to charge up the bull. (5) The wings of a dove. (6) Yellen wants to see more “prudent risk-taking.” (7) Lookout! Fed is on the lookout for bubbles. (8) Thanks, Fairy Godmother! (9) How will we know if it’s irrational exuberance? (10) Forward earnings still moving forward to new highs. (11) Focus on overweight-rated IT. (More for subscribers.)

Monday, September 16, 2013

Emerging Markets Driven By Commodity Prices (excerpt)


During the summer, the currencies of many emerging market economies (EMEs) took a dive. In addition, their bond yields spiked because capital inflows dried up as a result of all the tapering talk by Fed officials, which drove yields higher in the advanced market economies (AMEs) as well. Yet the Emerging Markets MSCI stock price index rebounded from a decline of 11.1% ytd on June 25 to a decline of only 1.2% on Friday.

This 11.2% rebound was mostly attributable to mounting signs that Chinese economic growth was picking up after slowing down earlier this year. The latest confirmation of that appeared in the 9/11 WSJ in an article titled, “China's Steel Industry Gains Steam.” The increase in economic activity has boosted demand for steel and concrete. A sudden surge in China's demand for iron ore has helped push the Baltic Dry Index, a measure of global shipping freight rates, to the highest level in more than 18 months.

However, there are mounting concerns, as I noted last week, that the government is resorting to the same old tricks of financing too many unnecessary infrastructure projects with too much debt. Total social financing, a broad measure of new credit in the economy, measured 1.6 trillion yuan ($261 billion) in August, nearly double July's 808 billion yuan.

It may be that Chinese government spending is having less bang per yuan on the economy. However, for now, it’s clear that like many other policymakers around the world, the ones in China will do whatever it takes to stimulate growth and avoid a recession.

If China can grow fast enough again to lift commodity prices, then the rally in the EME MSCI stock price index will continue. There is a very strong correlation between this index (and its forward earnings) and the CRB raw industrials spot price index. So far, the commodity index continues to flat-line, as it has been doing since the spring.

Today's Morning Briefing: Cover Curse. (1) Which team are you on? (2) Cover bull. (3) Ideal scenario for stocks. (4) Fall in the fall? (5) Q3 earnings season could be challenging for financial and global companies. (6) Another soft patch ahead. (7) Another fiscal fistfight ahead. (8) Taper Lite and more Yellen ahead. (9) German court to rule on OMT soon. (10) Euro zone’s weak production doesn’t jibe with region’s strong M-PMI. (11) Commodity prices yet to confirm rally in EME stocks. (12) Syria deal could be a big deal if it is serious. (13) It all adds up to neither boom nor bust, which is good for stocks. (14) Focus on market-weight-rated Consumer Discretionary Retailers. (More for subscribers.)

Thursday, September 12, 2013

The Great Rotation? (excerpt)


Over the past 13 weeks through the week of August 28, the Investment Company Institute estimates that bond funds had net cash outflows totaling $438 billion at an annual rate. Over the same period, equity funds had net cash inflows of $92 billion at an annual rate. I wouldn’t describe that as a “Great Rotation” just yet, but it could be the start of a big swing by retail investors into equities.

Monthly data show that equity funds plus equity ETFs had cumulative net inflows of $230 billion over the past 12 months through July, the best pace since December 2007. Over this period, equity ETF net inflows were a record $168 billion.

Today's Morning Briefing: Complacency. (1) Biblical warning. (2) Beware of bullish perma-bears. (3) Is doomsaying out of fashion? (4) Fewer recession scares. (5) The beginning of a Great Rotation? (6) The bears are mostly in the correction camp. (7) China’s hard landing postponed again. (8) Government-engineered liquidity squeeze scared Chinese officials more than lenders. (9) The Great Leap Backwards. (More for subscribers.)

Wednesday, September 11, 2013

In & Out of Fashion (excerpt)


It’s Fashion Week in New York City. It also seems to be fashion week in the stock market, with the bulls strutting down the catwalk while the bears are no-shows. Actually, investment styles have been changing rapidly all year. Consider the following:

(1) Dividend-yielding stocks. During the winter season, dividend-yielding stocks were the rage. They fell out of favor during the summer as bond yields soared. For example, S&P 500 Utilities were up by 18.4% ytd on April 30. Now they are up 6.1%. (However, S&P 400 Utilities are still up 16.8% ytd.) S&P 500 Telecom Services is up only 2.7%, well below the peak ytd gain of 15.6% on April 23.

(2) Interest-rate-sensitive stocks. Homebuilding and other interest-rate-sensitive stocks were also sold along with bonds during the summer. S&P 500 Homebuilding is down 29.6% since May 14, and down 9.6% ytd. However, Household Appliances and Home Improvement Retail are still up solidly so far with gains of 34.6% and 24.2%. While investors are worrying that rising mortgage rates may slow home sales, they must expect that owners of existing homes will spend plenty of money on remodeling.

Today's Morning Briefing: Go Global? (1) In and out of fashion. (2) Dividend yielders are out. (3) Retailers are pricey. (4) European shares have upside in revenues, margins, and P/Es. (5) Crises in some EMs turn into buying opportunities. (6) Some upbeat data made in China. (7) Commodity prices still flat-lining. (8) Energy and Materials likely to remain underperformers. (9) Global warming for investors. (10) Downgrading Consumer Discretionary to market weight. (11) Upgrading IT and Health Care to overweights. (More for subscribers.)

Tuesday, September 10, 2013

OECD Leading Indicators Mostly Looking Up (excerpt)


Almost on a daily basis recently, it seems that more and more global economic indicators are confirming that global economic growth is picking up. I’ve been especially encouraged by the OECD Leading Indicators, which have actually been rebounding since August 2012 and rose in July to the best level since April 2011.

The comebacks have been especially impressive for the US (101.1 in July), Japan (101.1), and Europe (100.4). Within Europe, leading the way higher are Ireland (102.1), Greece (102.0), Spain (101.8), Portugal (101.2), the UK (101.0), and Germany (100.4).

The global laggards are commodity-producers Australia (99.8) and Canada (99.6). The BRICs are still mostly losing altitude: Brazil (98.9), Russia (99.3), India (97.1), and China (99.4).

Today's Morning Briefing: 2014 In 2014? (1) Time to think about the end of next year. (2) A mini anxiety attack and mini relief rally. (3) The biggest relief may be better global growth. (4) Revenues outlook improving. (5) Analysts see upside for profit margins. (6) Raising our 2014 S&P 500 earnings estimate. (7) Now forecasting $120 in 2014 and $130 in 2015. (8) $130 x 15.5 = 2014. (9) Global leading indicators looking up for US, Japan, & Europe. Down for BRICs. (10) Good news out of China and Japan. (11) Europe’s recovery is a slow go. (More for subscribers.)

Monday, September 9, 2013

Earned Income Proxy at New High (excerpt)


Every month, The Employment Situation report compiled by the Bureau of Labor Statistics (BLS) provides an overwhelming amount of data about the labor market. When it is first released, I immediately focus on one key series that I derive by multiplying total hours worked in private industries by the comparable series for average hourly earnings. The first variable reflects the number of people working and their average hourly workweek. The second variable is a measure of their average hourly pay.

The result is our YRI Earned Income Proxy, which rose 0.6% in August to a new record high. That’s very good news since it tends to be highly correlated with wages and salaries in the private sector, which are included in personal income. Indeed, I’ve learned from the BLS that the preliminary estimate for the latter is based on an earned income proxy similar to the one we devised.

The YRI Earned Income Proxy is also highly correlated with retail sales. In other words, notwithstanding the widespread disappointment with August’s payroll gain of 169,000 and the downward revision of 74,000 in payrolls during June and July, the underlying trend in the labor market remains positive.

By the way, in his Barron’s column this week, Randy Forsyth reports that JPMorgan economist Michael Feroli “turned up a factoid in the establishment data that might account for some of the shortfall in payrolls--a record 22,000 plunge in motion-picture jobs last month.” A health scare in the adult segment of the industry last month caused a temporary work stoppage, which should be reversed next month.

Today's Morning Briefing: G-Rated Employment. (1) An employment report for the general public. (2) No graphic content produced last month. (3) Tiny tapering likely after all the taper talk. (4) Proxy for wages and salaries up at record high. (5) Full-timers working longer hours. (6) Full-time workers' wages rising faster too. (7) Jobless rate only 0.3 ppt from 7% threshold for QE to disappear. (8) Labor force dropouts reduce unemployment rate. (9) Who is dropping out and why? (More for subscribers.)

Thursday, September 5, 2013

The Second Recovery in US (excerpt)

US auto sales rose in August to a new cyclical high of 16.1 million units (saar), the best pace since November 2007. Domestic light truck sales are leading the auto industry’s recovery. This is the latest confirmation that our “Second Recovery” scenario for the US economy remains intact.

The simple thesis is that the delayed recoveries in auto and home sales built up plenty of pent-up demand, which is now boosting the economy. The recoveries in these two industries are self-reinforcing since the strength in light truck sales is partly attributable to more work in the construction industry.

Today's Morning Briefing: (1) Flat world exports put a lid on S&P 500 revenues during H1. (2) Global PMIs suggest better growth ahead. (3) Latest US data also looking up. (4) Auto sales confirm “Second Recovery” scenario. (5) Intermodal railcar loadings and trucking index show an economy on the move. (6) PMIs looking especially good in UK, euro zone, and US. (7) Looking OK in China. (8) Not so good in India and Brazil. (9) Focus on overweight-rated S&P 500 Transportation. (More for subscribers.)

Wednesday, September 4, 2013

Our Stock Market Indicator Taking a Rest (excerpt)


Our Fundamental Stock Market Indicators (FSMI), which rose to a new cyclical high during the week of August 3, is down over the past three weeks since then by 2.1%. This indicator has been highly correlated with the S&P 500 since 2000, and especially so during the current bull market.

The recent weakness in the FSMI has been mostly attributable to a decline in the Consumer Comfort Index component that more than offset the positive impact of falling initial unemployment claims, which is a second component of the FSMI. Meanwhile, the CRB raw industrials spot price index, the third component, has been flat-lining since the spring.

Today's Morning Briefing: Uncertainty. (1) Syria is serious concern. (2) Geopolitical jitters offset strong PMIs. (3) What will FOMC do if oil prices spike higher? (4) Forward earnings mostly stalling at record highs. (5) Uncertainty weighing on valuations. (6) Low but rising yields likely to keep a lid on P/Es. (7) US economic indicators are mixed. (8) M-PMIs show improving global manufacturing. (9) Global Net Earnings Revisions Indexes remain negative and have yet to confirm upbeat M-PMIs. (More for subscribers.)

Tuesday, September 3, 2013

China’s Economy Perking Up (excerpt)

The manufacturing purchasing managers' index (M-PMI), compiled by China’s National Bureau of Statistics, rose to 51.0 in August from 50.3 in July, the highest level since last April and ahead of market expectations of 50.6 in a Reuters poll. The official survey showed an across-the-board recovery in all sub-indexes, ranging from new orders and quantity of purchases to input prices and employment, pointing to a positive picture for the huge factory sector.

Confirming the strength of China’s economy are electricity output and crude oil usage. Both rose sharply during July to new record highs. On August 13, I noted that an exclusive report in South China Morning Post revealed that the “mainland government is quietly offering financial stimulus to key cities and provinces to help them maintain local economic growth.” Instead of massive economy-wide stimulus, the government is targeting big projects around the country to stimulate growth. The new approach seems to be working.

Today's Morning Briefing: (1) Postponed US attack on Syria is a relief for market. (2) So are lots of strong global economic indicators. (3) A quick tour of the World according to MSCI. (4) World earnings estimates still falling, but a hint of better times from recent revenue estimates. (5) China’s bottom-up stimulus may be working. (6) Improving UK economy starting to discredit the anti-austerians. (7) Euro zone continues to show upside surprises. (8) US exports revision confirms improving global economy. (9) Reviews are mixed for Abenomics. (10) “Closed Circuit” (-). (More for subscribers.)